| Corcoran Technical Trading Patterns For October 20 |
| By Clive Corcoran |
Published
10/20/2010
|
Stocks
|
Unrated
|
|
|
|
Corcoran Technical Trading Patterns For October 20
On Monday I mentioned that a focus chart for this week would be the Aussie/yen or AUD/JPY.
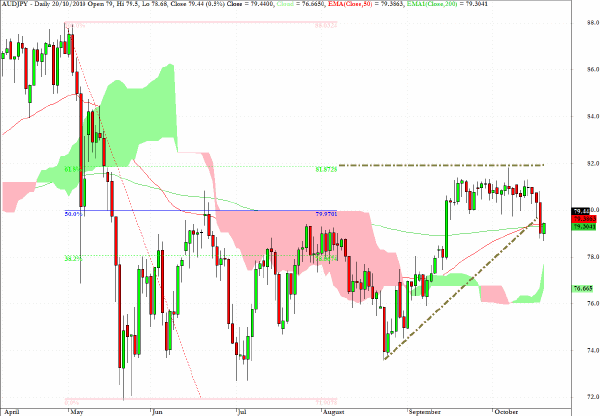
Below is a daily chart for the pair and added to the graphic is a fibonacci grid predicated on the high value of just over 88 seen on April 30 of this year and the most recent multi-period low of 71.86 seen on May 21. As can be seen, the 62% retracement level corresponds to approximately 81.85 which was touched intraday on October 7 but which met with rejection. Following yesterday’s sharp drop the pair has fallen below the 80 level which marks the 50% retracement level and now a target of 78 is activated at the 38% level which also marks the top of the green cloud on the right hand side of the chart.
Interestingly, if one reviews a longer-term weekly chart, which I have shown here recently, the 81.80 zone also represents the 50% retracement from the multi-year swing high/low levels. Moreover, the swing high or top shown on the chart below at approximately 88 also marked the 62% retracement on the longer-term fibonacci grid.
Putting all of this together, the suggestion is that the Australian dollar is revealing a pattern of failures against the yen in its attempts to attain and exceed key fibonacci retracement levels. The suggestion is that the region close to 75 (38% on the weekly grid) seems like a feasible intermediate-term target.
This analysis would lend further support to the intuition that there are growing signs that risk aversion is beginning to re-surface which is also being reflected in hesitation about extending and adding to the hot money flight into a variety of emerging market asset classes.
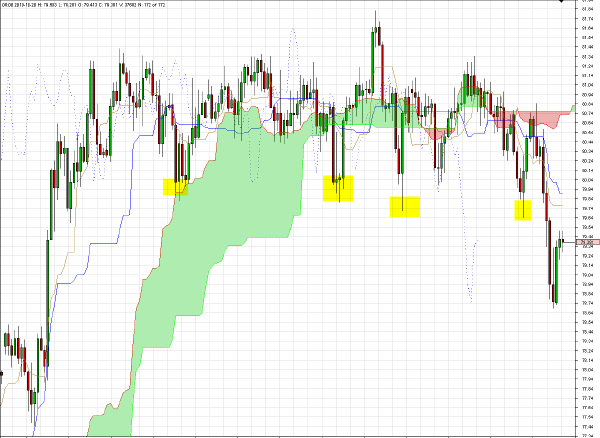
Updating a theme from Monday’s Daily Form, the chart below is the 240-minute chart of AUD/JPY showing that the succession of lower lows discussed in that commentary were a good tip off to yesterday’s steep drop.
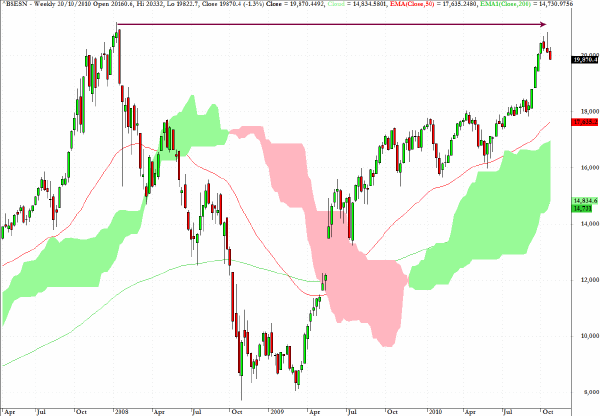
Also noted here recently was the suggestion that the Mumbai index (BSESN) was showing signs of topping behavior. The weekly chart shows that the index has stalled at a rather key level.
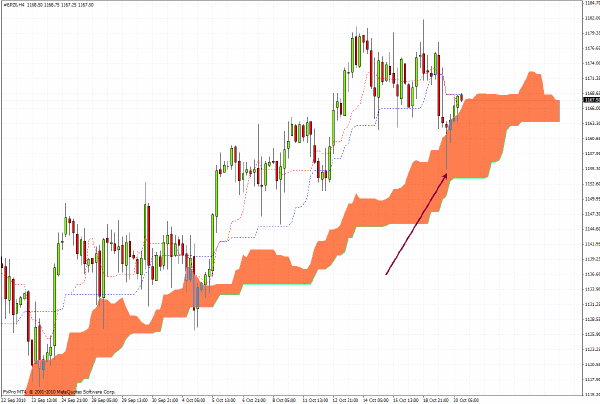
The S&P 500 futures spiked down to the 1155 level during yesterday’s session and I would suggest that there would be value in monitoring the 240-minute chart for evidence that the recent uptrend line is being violated, which, given the current Ichimoku configuration, will also be corroborated by a close below the cloud formation.
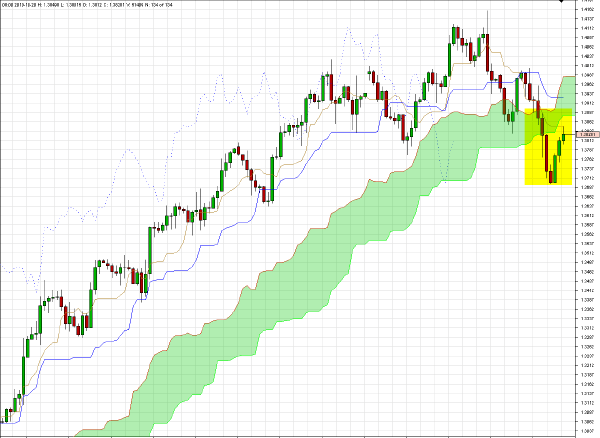
EUR/USD broke below important support yesterday and it now becomes quite critical for the single currency to take on the challenge of remaining above the $1.40 level. A failure to break back above the top of the cloud formation would suggest that an intermediate-term top was registered on October 15.
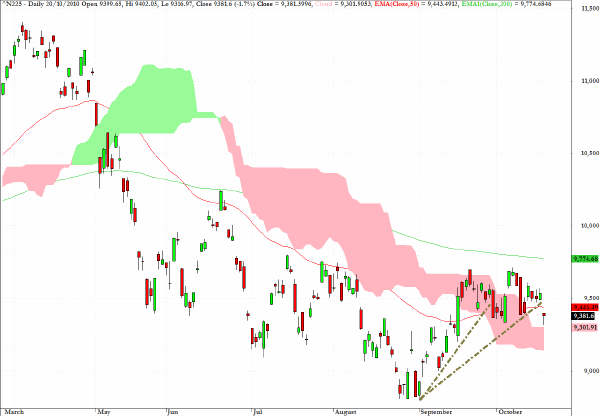
In Asian trading Wednesday, the Nikkei 225 slipped back 1.7% and closed below the 50-day EMA.
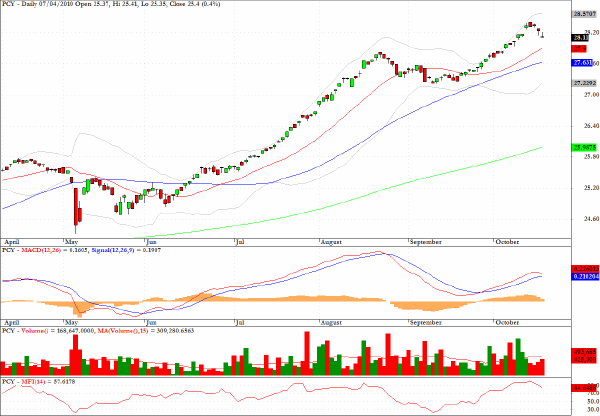
PCY, the exchange traded fund which tracks the sovereign debt from emerging markets, shows a clear example of a negative MACD divergence.
Clive Corcoran is the publisher of TradeWithForm.com, which provides daily analysis and commentary on the US stock market.
|