| The McMillan Options Strategist Weekly |
| By Lawrence G. McMillan |
Published
10/22/2010
|
Options
|
Unrated
|
|
|
|
The McMillan Options Strategist Weekly
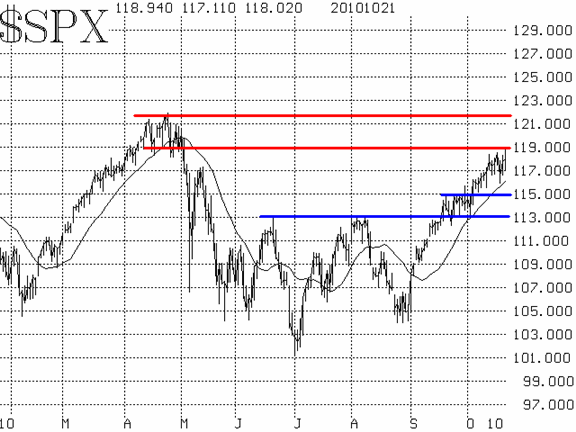
The $SPX chart is bullish, as it continues to rise and stay above its 20-day moving average, which is now at about 1160. That is also Tuesday's low, so it represents the first level of support.

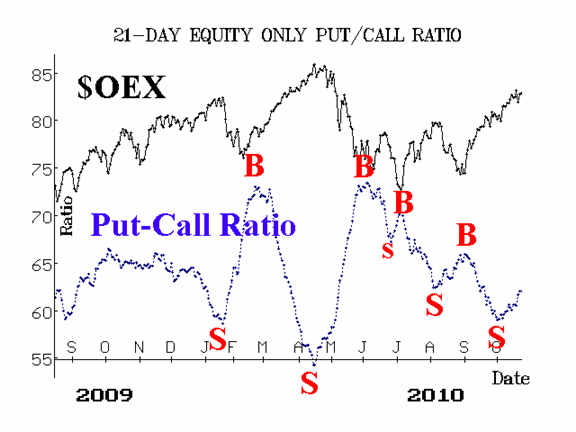
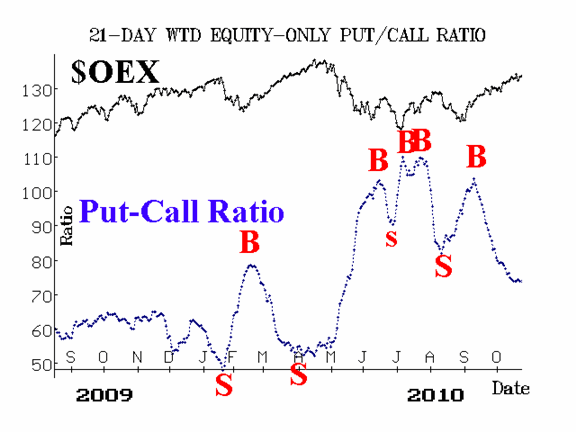
The equity-only put-call ratios are weakening. The standard ratio rolled over to a sell signal, prematurely, about three weeks ago. The weighted ratio has not given a sell signal yet, but as you can see from Figure 3, it is beginning to flatten out, and a sell signal would be generated if it turns and begins to rise.

Market breadth is modestly overbought at current levels.

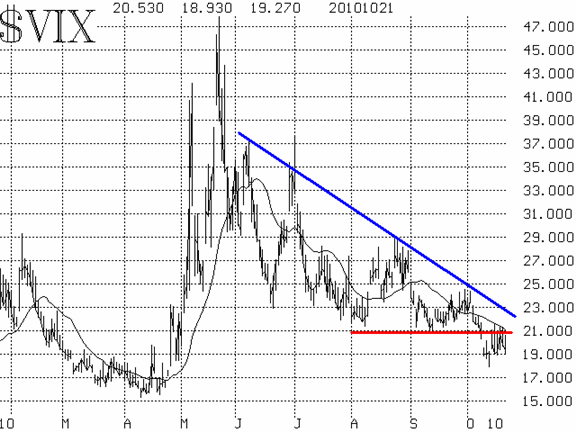
Volatility indices ($VIX and $VXO) have remained in downtrends (generally) and thus continue to paint a bullish picture.

In summary, the intermediate-term indicators are bullish, and until there is some breakdown by $SPX below support levels, we will not take bearish positions.
Lawrence G. McMillan is the author of two best selling books on options, including Options as a Strategic Investment, recognized as essential resources for any serious option trader's library.
|