Clive Corcoran is maintaining his view that the risk/reward matrix for the next 30 or so points on the S&P 500 is not favorable.
The hourly chart for the S&P 500 futures shows that the index still has to break above the ascending trend line through recent lows which also coincides with the top of the cloud formation at around 1184.
Although it is hard not to believe that with the numerous supportive factors for US equities (including bountiful amounts of POMO and other "liquidity provisioning") we will not see a test of 1200 in coming sessions, I am maintaining my view that the risk/reward matrix for the next 30 or so points on the S&P 500 is not favorable. Although it is unlikely, before the key events of next week in the US, that there would be any break down below 1165 in the remaining sessions this week, if such an eventuality was to occur it would then put in play again the 1155 intraday low from October 19. 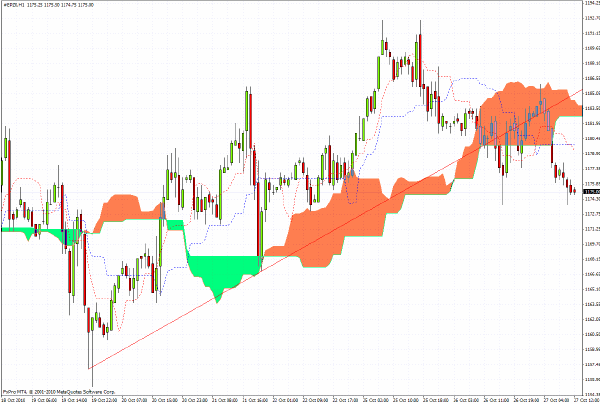
I commented recently that the Hang Seng Index (HSI) appeared to be struggling to move above the 62% retracement level of 23,800 (based upon multi-year highs and lows observable during the last three years).
The 1.9% drop in Asian trading on Wednesday morning contributes another big red candlestick in what is becoming a bearish looking chart formation. 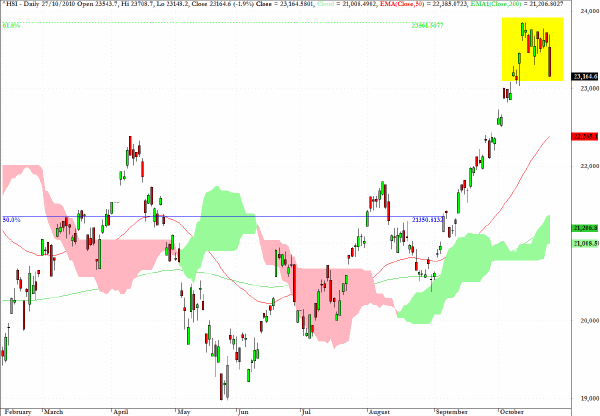
I'll repeat the comment from yesterday’s commentary.
EUR/USD has broken twice below significant uptrend line and may need to retest the $1.38 level as it has been unable to retain a footing above $1.40.
Having taken profits on the attainment of $1.38, currently I am positioned for a relatively short term bounce back towards the $1.3890 level, where I would again be considering selling the euro. 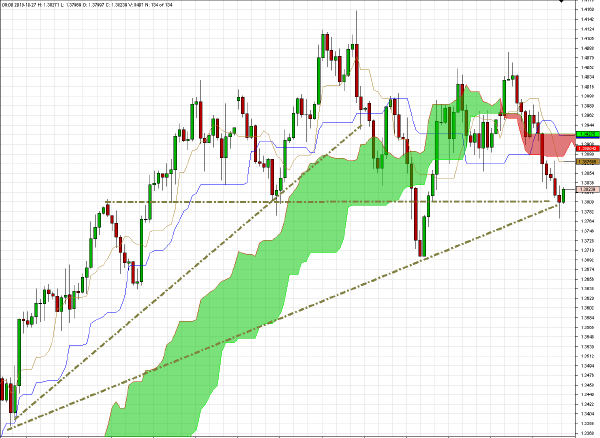
Rather noticeable upward movements in yields of US Treasuries, gilts and even bunds suggest that the recent episode of ultra low yields may be drawing to a close.
Yesterday’s GDP number in the UK has definitely changed the landscape for further QE from the BofE and the US markets may well have already more than discounted at least $500bn of QE2 from the Fed.
The pattern on the 30-year Treasury yield - if it develops further into the cup/handle formation as depicted - would suggest that this is not the place to be when the exodus out of longer-term UST’s gains momentum.
As yields move higher it should also help to increase bids under the US dollar which would not be the most benign environment for US and emerging market equities. 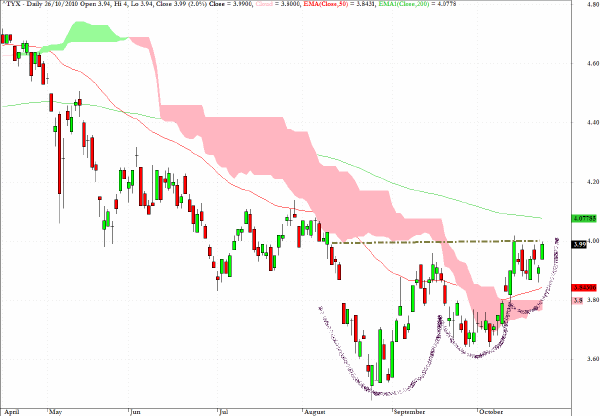
The chart for TBT, which moves in tandem with increased yields on long-term US Treasuries, shows that for the first time in many months there has been a break above the pink cloud formation. 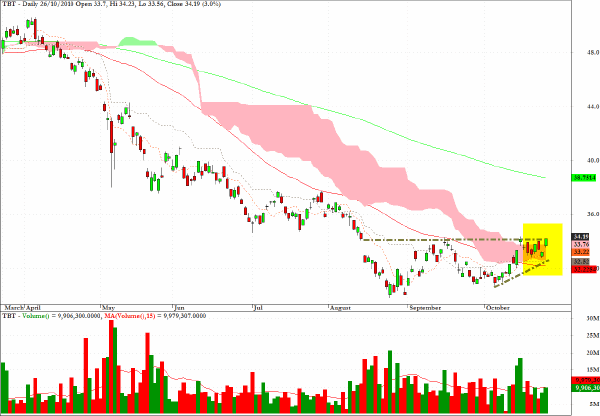
CEW, which is an ETF marketed under the moniker Wisdom Tree Dreyfus Emerging Currency, seeks to achieve total returns reflective of both money market rated in selected emerging market countries available to foreign investors and changes to the value of these currencies relative to the U.S. dollar.
A short position would be a recommendation for those with a longer-term holding period perspective. 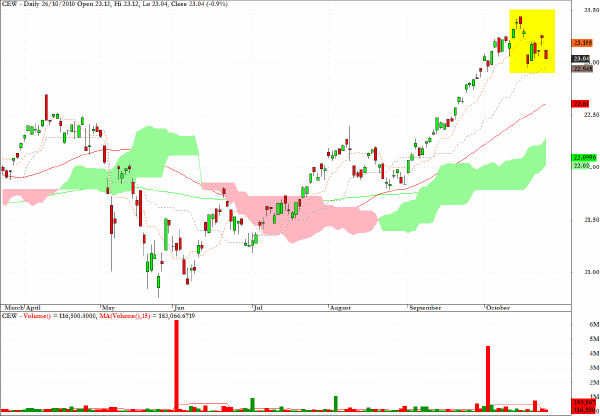
AUD/JPY looks to be technically vulnerable to a correction down towards the 78 level in the first instance. 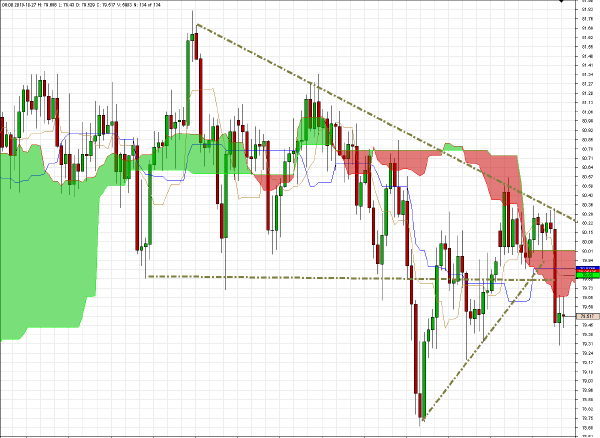
Research in Motion (RIMM) surged yesterday on massive volume but met resistance at the 200-day EMA. The clear break out from the descending trend line through the highs suggests that this stock should be accumulated on any significant pullbacks. 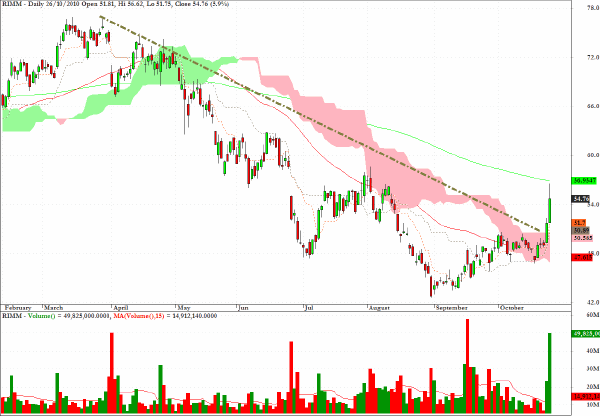
Here again are comments from a Daily Form column from last week.
The exchange traded fund YCS represents a leveraged vehicle which rises on yen weakness. I am not trying to call a bottom in the dollar/yen rate but I would say that for those with a longer term horizon there are some technical suggestions that the US currency looks "sold out" against several currencies, and in particular the yen. 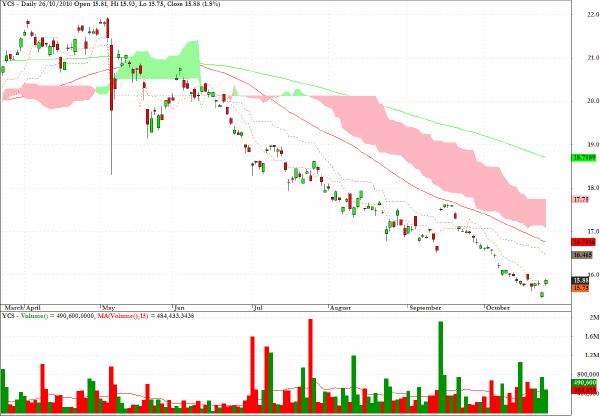
EWH, an exchange traded fund which provides exposure to the Hong Kong market, provides a suitable vehicle on the short side for those persuaded that it is of some consequence that the Hang Seng Index is revealing evidence of failure at the 62% retracement level (see above). 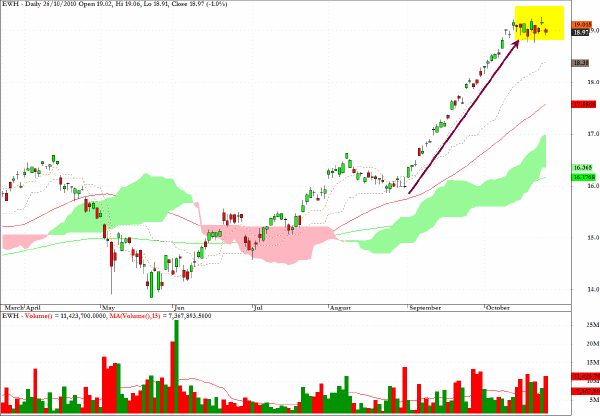
Clive Corcoran is the publisher of TradeWithForm.com, which provides daily analysis and commentary on the US stock market.