| Corcoran Technical Trading Patterns For October 29 |
| By Clive Corcoran |
Published
10/29/2010
|
Stocks
|
Unrated
|
|
|
|
Corcoran Technical Trading Patterns For October 29
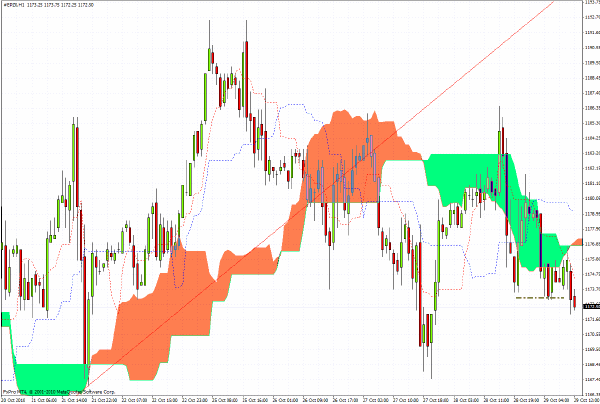
The S&P 500 futures are struggling during European trading on Friday morning following weak performances in Asia and a lackluster session for the major European markets.
The S&P 500 e-mini contract is currently at 1170, which is below yesterday’s intraday low and now seems set to challenge the 1167.50 level seen on Friday. In this region there is quite significant chart support, but if that should fail to arrest an intraday sell-off then I suspect that 1155 would be the obvious next target.
As stated here several times recently, the journey from 1175 back to the April high around 1220 has been a very choppy one and is really testing the fortitude of the bulls. On the other hand it also suggests that there are a lot of traders trying to pick an intermediate-term top who would provide lots of buying power when they cover their positions should the index break decisively above the 1193 area.
For the time being I prefer to watch the dance from the sidelines.
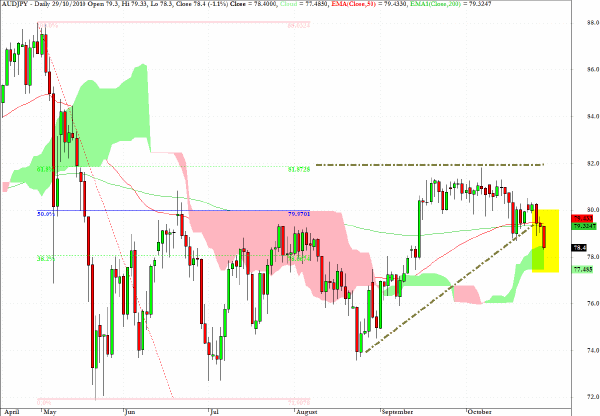
AUD/JPY has almost attained the 78 level, and I did say in Wednesday’s column that I would be expecting a move towards this key level which actually represents the 38% retracement level on the fibonacci grid shown on the daily chart below.
I have exited my short position for the time being, but longer term I would suggest that the chart configuration - which is quite negative - suggests an eventual return to the more critical 75 level.
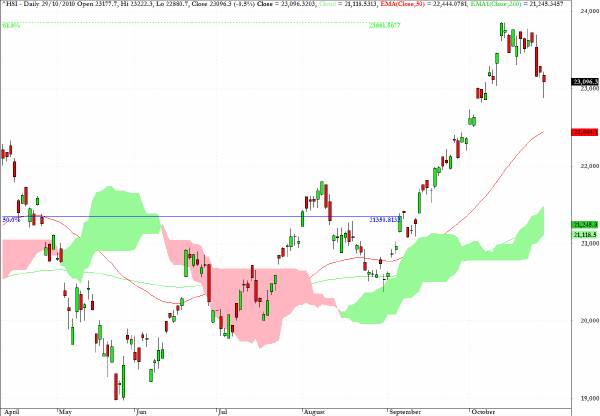
The Hang Seng Index (HSI) has continued to correct, as suggested earlier this week. The long lower tail shows that some buying support emerged at the 23,000 level but a revisit to the 50-day EMA at 22,400 seems feasible.
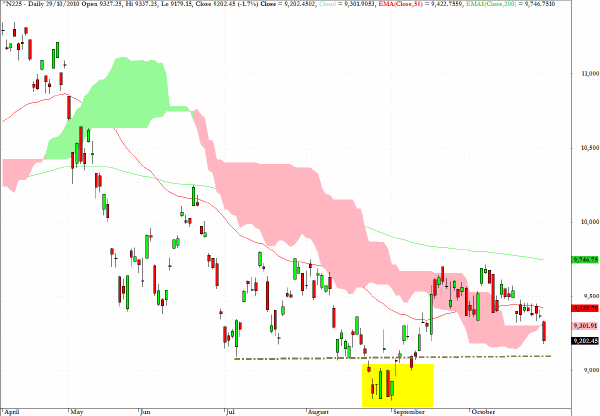
The Nikkei 225 took it on the chin again in Asian trading as the yen continues to strengthen.
As visible on the chart, with the exception of the highlighted area, the 9200 level has provided support over the last several weeks so it will be worth monitoring whether this support holds during next week, which for all of the obvious reasons related to developments in the US, is expected to be an eventful week for global capital markets.
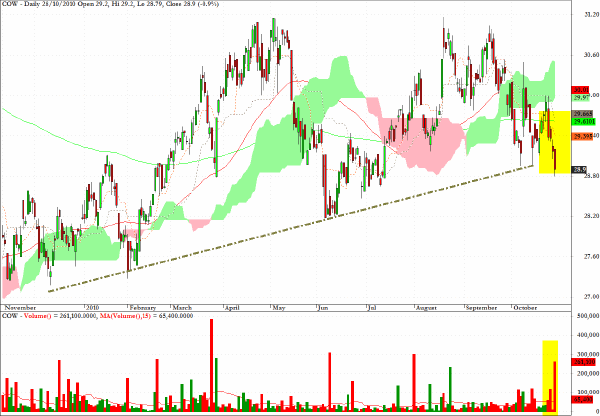
COW, an exchange traded fund which is designed to reflect the performance of livestock and is composed of futures contracts on lean hogs and live cattle, has reached a level where a long-term trend line of support is now in jeopardy.
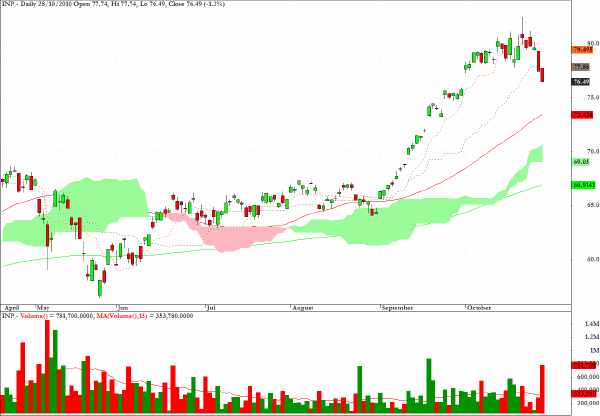
INP which tracks the MSCI India index is revealing corrective behavior following the clearly visible shooting star pattern registered last week.
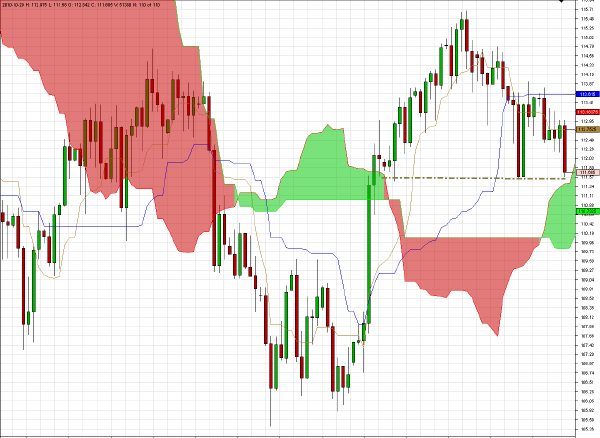
Following a profitable trade recently selling EUR/JPY the current chart configuration suggests that at least a short-term, scalpable (if there is such a word) bounce, appears to satisfy the risk/reward trade-off at the 111.50 level.
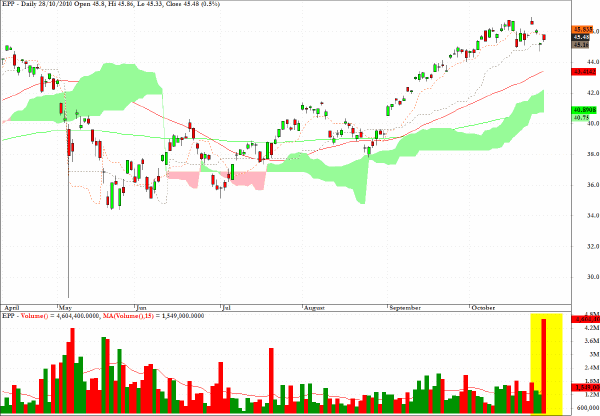
More than three times the average daily volume was seen on EPP yesterday.
One other noteworthy feature of the chart is the extreme low reading seen on May 6 which suggests that this fund is one of the cluster of ETF’s that are tied into "arbitrage" activities with FX trading, about which I have made several comments over the last few months.
Clive Corcoran is the publisher of TradeWithForm.com, which provides daily analysis and commentary on the US stock market.
|