NASDAQ Commentary
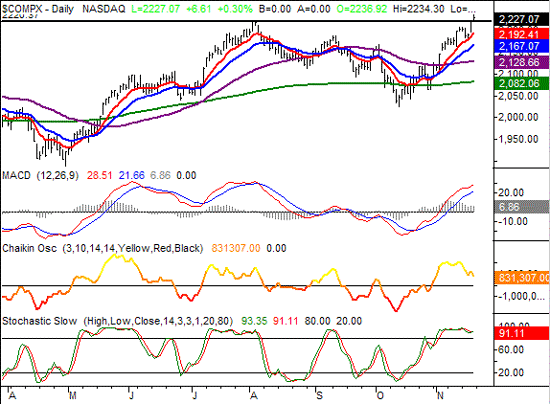
Last week's 24.6 point gain for the NASDAQ Composite left it at 2227.07, which was a new 52-week high. For that matter, it was a new multi-year high. So, in that respect, there has to be some acknowledgement of the bullish momentum that got us here. However, after the 1.1 percent gain - the fifth straight weekly gain - we're also wondering if the market has run out of gas, at least in the short run.
In the grand scheme of things, the composite has obviously broken past the resistance we pointed out last week, and it did so after bouncing off the 10 day average on Wednesday. As close as the NASDAQ was to doing this, to see it occur wasn't really a surprise. As such, we're bullish in the bigger picture, and expect the last few weeks of this year to be rather good.
But in the meantime, the same problems we were facing last week are stil out there. Namely, we're still well into an overbought situation. Although we're bullish for the rest of the year, we still have to expect at least another small, corrective dip before the next major bullish leg. Aside from being stochastically overbought, the short-term bearish expectation stems from the falling Chaikin line. Even though the NASDAQ has gone higher over the last several days, the Chaikin line is pretty efficient at spotting the true direction of volume. It also leads the index, so to see it headed lower right now tells us that not all is quite as bullish as it seems.
However, keep it al in perspective. The 10 day line is about as deep as any correction may go. That average is currently at 2192, which is only about 35 points under Friday's close. Yes, that would pull the NASDAQ back under those new highs, but that new high barrier has already been broken.
NASDAQ Chart

S&P 500 Commentary
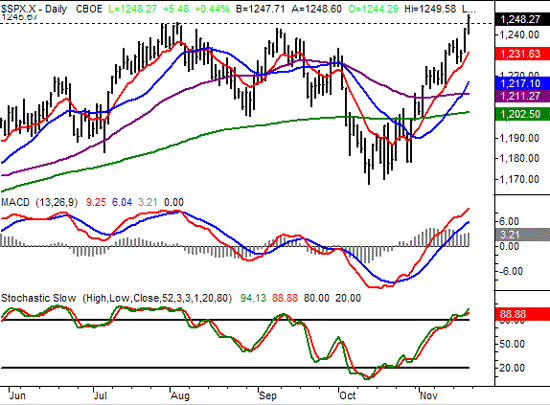
The S&P 500 also eclipsed the new 52-week (and multi-year) high mark this week, with its close at 1248.27. That 1.1 percent/9.5 point gain was the fourth straight winning week for the large-cap index, and like the NASDAQ, we have to think that stocks are due for a short breather in the very near future. Yet, we also know that the coming week is historically a good one, even though it's cut short by a session and a half for Thanksgiving.
Momentum-wise, there's not a lot to add here. The market is clearly going higher, and as technicians, we inherently have to assume that the trend will remain in place until we have a clear reason to think otherwise. On the other hand, we also have to be realistic and acknowledge that everything has a limit.
Like the NASDAQ, the worst we can expect now is a dip back to the 10 day line at 1231.6. That's 17 points away, and keep in mind that the 10 day line's current rise will close that gap rather quickly. After that, we remain bullish. As for a target, we're not going to set a target level. Instead, we're going to set a time limit. We anticipate this bigger bullish trend staying strong through the end of this calendar year. As of the first trading day of 2006, all bets are off, so to speak. That was exactly how last year played out, and the risk of a repeat is too great to merit any other course of action. We still think January will be bullish, though, after an initial small correction.
S&P 500 Chart

Dow Jones Industrial Average Commentary
Although the Dow isn't at new 52-week highs, the blue-chip index did manage to break above that big resistance line at 10,720. The index closed at 10,766 for the week, gaining 80 points, or 0.7 percent. Even though that big hurdle hasn't been crossed yet, overall, we're bullish. But like the other indexes, we have to think a brief correction is in the works before the Dow is really let off the leash.
The new-high point for the Dow is at 10,984 - which is out of reach for the time being. By the time the Dow gets there, the rest of the market will be well past its prior highs, and well into uncharted territory. When that finally occurs, the Dow should have no problem staying on a course that will take it past that level.
But, the time-based target applies here too. Be cautious at the transition between this year and next year.
Dow Jones Industrial Average Chart

Price Headley is the founder and chief analyst of BigTrends.com.