| Corcoran Technical Trading Patterns For November 2 |
| By Clive Corcoran |
Published
11/2/2010
|
Stocks
|
Unrated
|
|
|
|
Corcoran Technical Trading Patterns For November 2
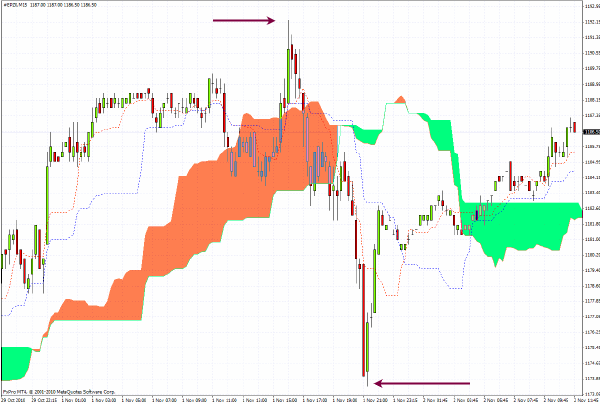
The 15-minute chart for the S&P 500 futures over the last 48 hours or so reveals very clearly the two points that I have made here regarding this key US benchmark index. The two arrows point to the two critical levels that are prevailing at present --- and both were touched within about 4 hours of each other.
The 1193 zone is clearly the top of the recent range and a failure to penetrate that level yesterday energized traders to immediately test the lower support level at 1173 as anticipated in my comment here yesterday.
At present the futures in European trading are around the 1187 level (approx 62% of the swing high/low visible on the chart below).
The next 24 hours will be quite critical for this index, and if I had to guess (I don’t plan to trade this way, however) I would be looking for a break above 1193 with perhaps a quick run towards the April high, but I would then be wary of an abrupt reversal.
If 1165 is taken out then there could be a scramble for the exits and if 1220 is exceeded then there would be a lot of large position traders within hedge funds that would be scrambling to cover. Either way there should be substantial range expansion which would lead to greater volatility and benefit option buyers and punish option sellers.

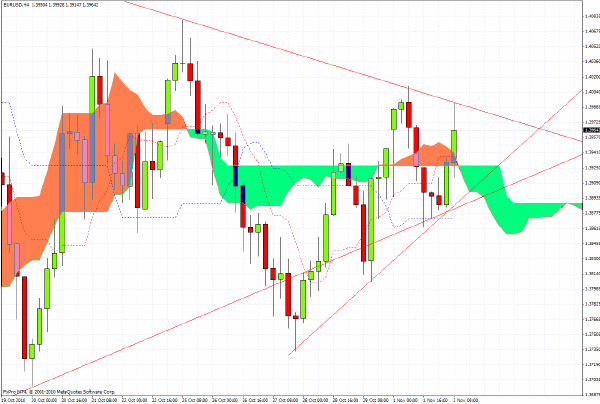
EUR/USD has reached into the apex of a key triangular formation which will need to be resolved soon. At the time of writing the euro is poised at the top of a descending trend line through highs which is seen on the 240-minute chart below.
Retreating from the technicals for a moment the fundamental position is that the announcement from the Fed regarding QE will highlight the almost impossible agenda for Ben Bernanke. On the one hand he faces the requirement to please the Administration and the consensus view that structural unemployment in the US needs more asset purchases (fallacious reasoning perhaps, but still politically expedient), and on the other hand the US is facing mounting of pressures from EM economies that the last thing that their markets need is even more hot money seeking out higher yields in their asset markets and forcing up the value of their currencies.
Despite a lot of attempts to try to smooth over the gaping cracks by policy makers mindful of the need for diplomatic rhetoric, it is worth emphasizing the point that there is a currency war already in effect and it is likely to get considerably more fractious.

Since I have nothing further to add today, I shall bask in the fact that some recent recommendations made here on specific trades have done remarkably well and I thought I would highlight a couple of the more rewarding suggestions.
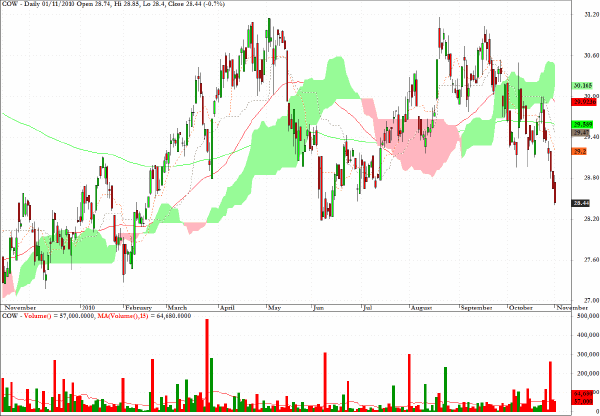
Here is what was noted on September 29.
COW, an exchange traded fund which is designed to reflect the performance of livestock and is composed of futures contracts on lean hogs and live cattle, has reached a level where a long-term trend line of support is now in jeopardy.

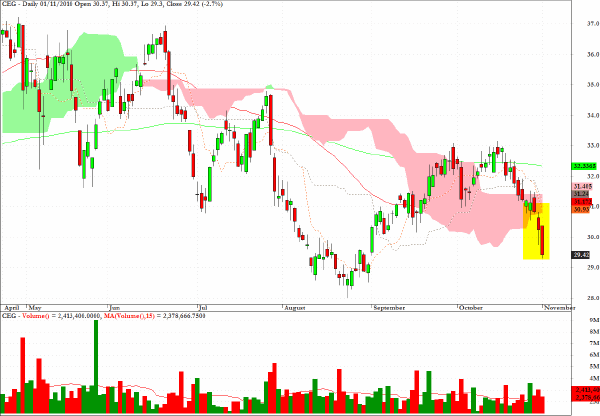
Here again is a reminder of a comment from yesterday which in turn relates back to comment from a column in early October.
Constellation Energy Group (CEG) dropped below its 200-EMA and violated an uptrend line on heavy volume in yesterday’s trading.
After completing a pullback in mid-October the stock has now delivered a decent return on the short side and could potentially fall back towards the previous low from late August that is visible on the chart.

Clive Corcoran is the publisher of TradeWithForm.com, which provides daily analysis and commentary on the US stock market.
|