| Corcoran Technical Trading Patterns For November 4 |
| By Clive Corcoran |
Published
11/4/2010
|
Stocks
|
Unrated
|
|
|
|
Corcoran Technical Trading Patterns For November 4
If there was any doubt before that the primary purpose of QE was to "foster" higher asset prices, then those doubts were removed yesterday when Chairman Bernanke specifically went on record to endorse the "wealth effect" that comes from higher stock prices.
In our Alice Through the Looking Glass financial system two old expressions come to mind:
1. Don’t Fight the Fed - now means don’t fight higher stock prices.
2. When Wall Street wants to have a sale it puts up its prices - now the Fed will do that for them by feeding the US Treasury bond Ponzi scheme.
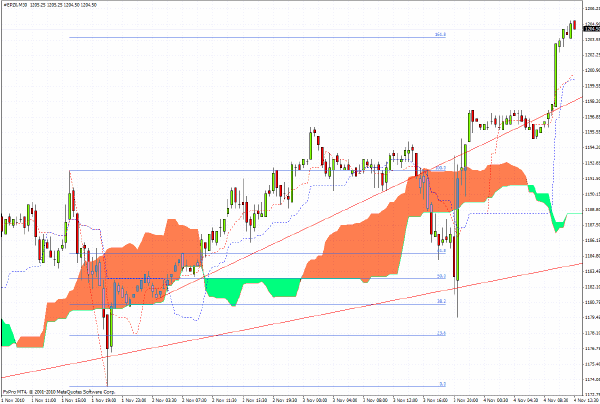
S&P 500 futures are trading around the 1200 level in Europe which, as can be seen from the 30-minute chart shown earlier this week, represents the 162% extension from the critical high/low range in effect recently of 1193 and 1173. Further fibonacci extension targets of 268% and beyond are left to the reader as an exercise (just joking, well maybe not!).
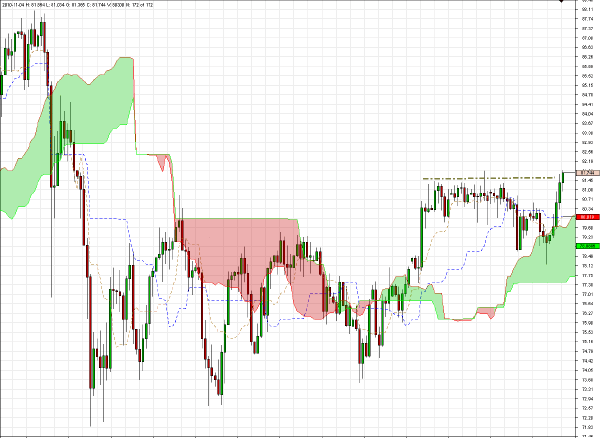
Risk ON is now in the driver’s seat again - and monitoring a useful gauge for just how safe it is to engage with the most adventurous asset classes would be to keep an eye on AUD/JPY which now appears to have penetrated the upside target of 81.80, discussed here several times. Potentially longer term levels around 85 are now in play again, but should the 81.80 be broken decisively to the downside then that would be a sign not to overstay the welcome provided by the Fed’s generosity ( or should that be addiction to Ponzi finance).
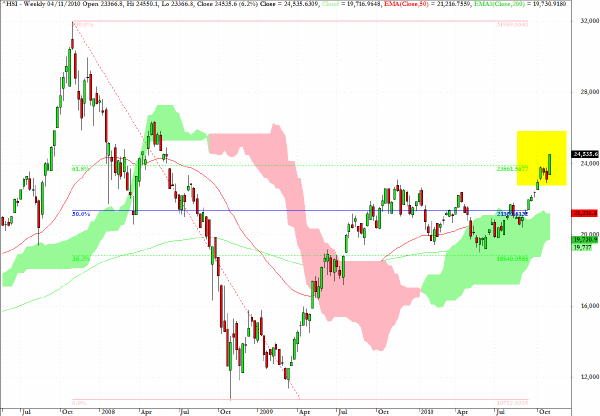
What better indicator that the risk on traders are celebrating today than the performance of the Hang Seng Index, which, after appearing to enter a corrective phase at the 62% retracement level last week, has surged ahead in today’s trading.
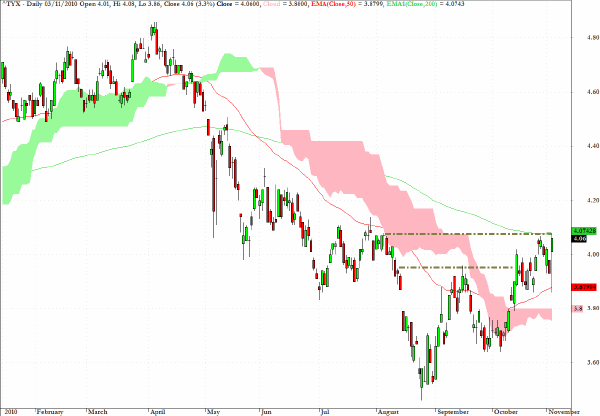
One of the bigger casualties from yesterday’s QE announcement was the long end of the US Treasury spectrum as the Fed made clear that it will focus its asset purchases in the intermediate-term maturities.
The yield broke above 4% and if it can now break above the 200-day EMA, which coincides exactly with yesterday’s closing yield of 4.06%, then the 50-week EMA level at 4.25% level could be the next target.
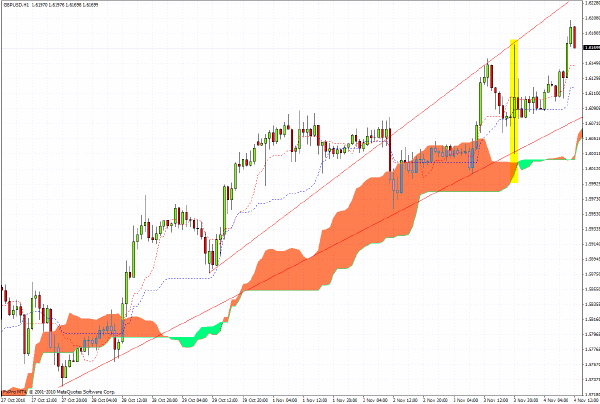
I have highlighted a key bar on the hourly chart for GBP/USD which was the reaction immediately following the FOMC announcement yesterday.
Remarkably the range covered fits exactly into the trend channel shown and the extension reveals that the $1.6350 level would seem feasible now as a resistance barrier with $1.6070 as fairly key support.
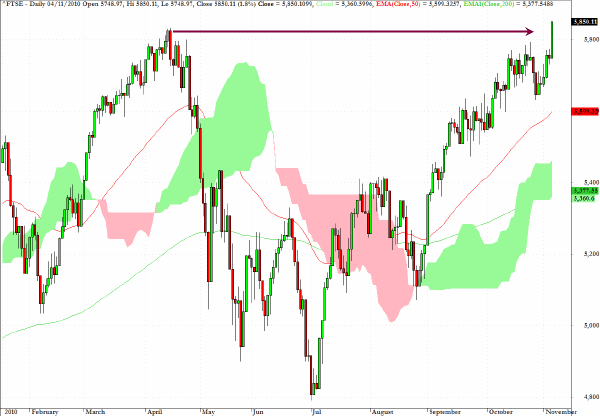
The FTSE index has now surpassed its April high in European trading.
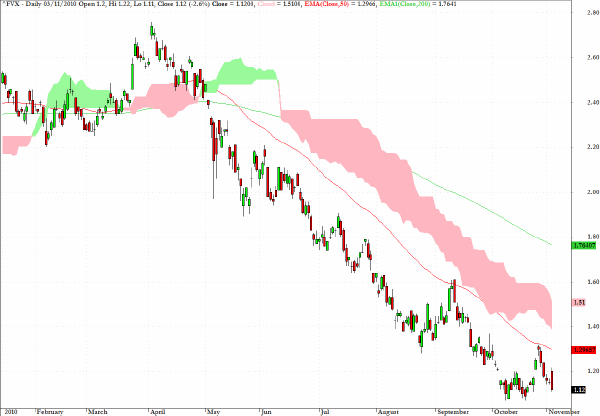
The yield on the five-year US Treasury dropped back towards its multi-year low level as it will be the main beneficiary of the QE program
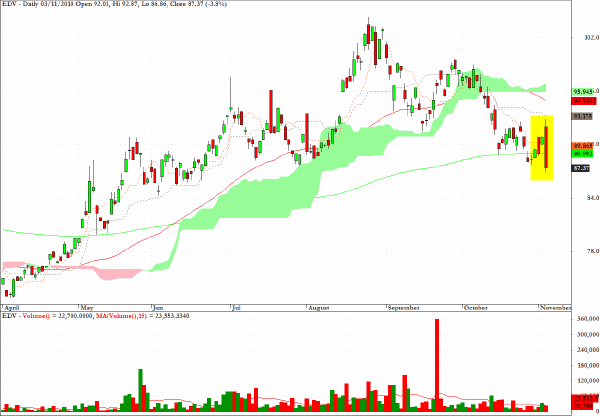
Two exchange traded funds provide vehicles for those wanting to take a position on the out of favor long end of the US Treasury yield curve. EDV represents extended duration US Treasury strips and pullbacks might appeal to those believing that this is where the most pain should be expected and where entry opportunities on the short side are most appealing.
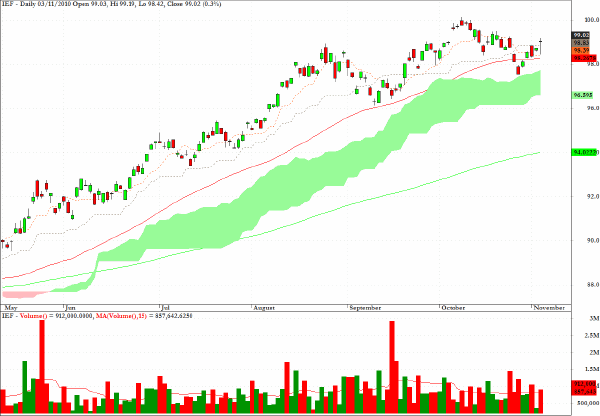
IEF is the other ETF which allows access to prices of UST’s in the 5-7 year maturity range.
Clive Corcoran is the publisher of TradeWithForm.com, which provides daily analysis and commentary on the US stock market.
|