Good morning! The strong end of the week rally we saw begin last Wednesday continued into Friday as the market gapped higher following Thursday's strong late day breakout to daily highs. This extended the market on the smaller intraday charts and made it difficult to sustain. We started to see a turn around when the Dow Jones Ind. Ave. formed a 2T reversal pattern intraday by making only slightly higher highs into the 10:15 ET reversal period. That 2T kicked off a morning reversal that would continue well into noon.

The selling picked up pace when the morning lows gave way. The Dow and SP500, which had the strongest gap, fell the hardest since they had the most room to move before support would hit. The pace slowed on the decline once the morning gap filled, however, leading to some rounding off at lows heading into the mid-day doldrums. Things became pretty choppy at this time as the market tried to bounce, but kept falling back to lows. The slightly lower lows caused a problem for the bears because the market essentially trapped them by trying to break lower before an adequate correction on the 5 minute charts had occurred. Only the NASDAQ managed to put in a longer base without the trap action of new lows over lunch, but it held up as the other two began to round off at lows and pull higher into the early afternoon.
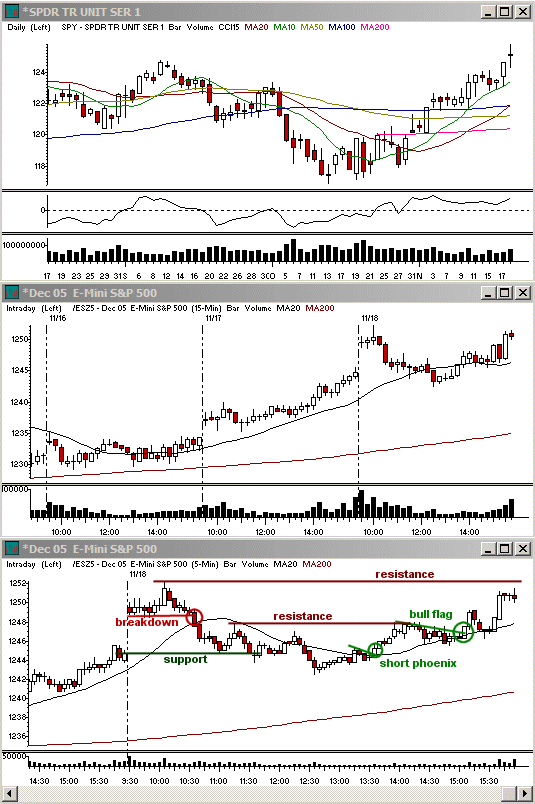
There was quite a lot of divergence between the indices once again on Friday afternoon. As we saw the prior afternoon, The SP500 and Dow Jones Ind. Ave. led the way higher. They began slowly, but picked up pace once the 5 minute 20 sma resistance broke. The 5 minute 20 sma served as support on a bull flag into 15:00 ET and both continued to move up into the close. The SP500 and Dow managed to make it back into the zone of morning highs. This time, however, the NASDAQ never did manage to make it onto its feet. Instead it based in the lower half of the days range throughout the afternoon.
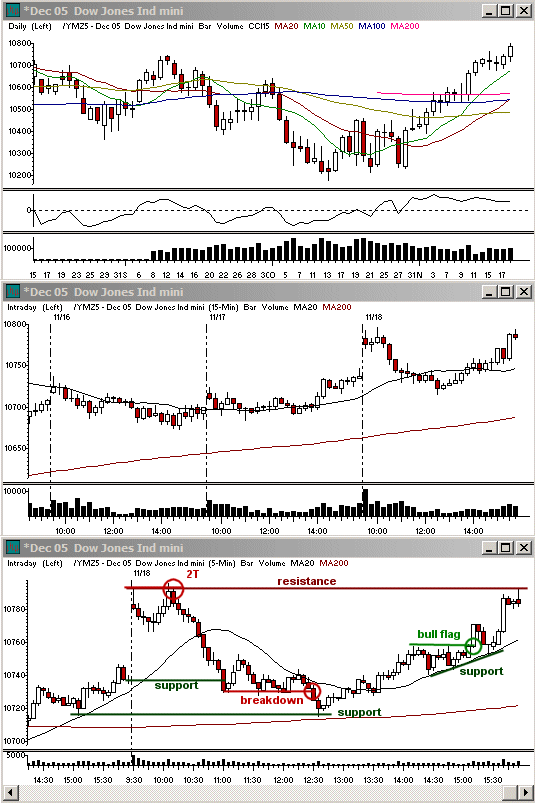
Although we did see a slowdown in the upward momentum of the market on Friday, we haven't seen it able to maintain any change in pace to favor a pullback on the daily charts yet. In order to see a strong retracement from these levels, we would need to see more rounded highs. In other words, the market would need to make higher by lesser degrees with stronger and stronger pullbacks in between. Otherwise, the correction is going to be more on the choppy side and a lot more gradual than this upward rally that has taken place over the past month. This latter scenario is the most like given that the monthly charts are now breaking out and volume overall has held up well, slowing only on correction on the 60 minute charts.
Economic Reports and Events
Nov. 21: -
Nov. 22: Existing Home Sales for Oct. (10:00 am), FOMC Minutes (2:00 pm)
Nov. 23: Initial Claims 11/19 (8:30 am), Mich. Sentiment-Rev. for Nov. (9:45 am), Help-Wanted Index for Oct. (10:00 am), Crude Inventories 11/18 (10:30 am)
Nov. 24:-
Nov. 25:-
Nov. 28: Existing Home Sales for Oct. (10:00)
Nov. 29: Durable Orders for Oct. (8:30 am), Consumer Confidence for Nov. (10:00 am), New Home Sales for Oct. (10:00 am)
Earnings Announcements of Interest
Only stocks with an average daily volume of 500K+ are listed. List may not be complete so be sure to always check your stocks' earnings dates before holding a position overnight. (A) = Earnings after the close, (B) = Earnings before the open, (?) = Earnings time not specified at the time of this writing
Nov. 21: CPB (?), CBRL (?)
Nov. 22: ABS (?), CWTR (A), DE (?), DG (B), DLTR (B), HRS (?), MIK (A), OPSW (A), PETC (?)
Nov. 23: CHINA (?), MBT (07:00 am ET), PDCO (B)
Nov. 24: -
Nov. 25: -
Nov. 28: -
Nov. 29: CHS (A), GME (B), SMTC (A), SCMR (B), TIVO (A)
Toni Hansen is President and Co-founder of the Bastiat Group, Inc., and runs the popular Trading From Main Street. She can be reached at Toni@tradingfrommainstreet.com.


 Free Festival of Traders Videos