| Corcoran Technical Trading Patterns For November 8 |
| By Clive Corcoran |
Published
11/8/2010
|
Stocks
|
Unrated
|
|
|
|
Corcoran Technical Trading Patterns For November 8
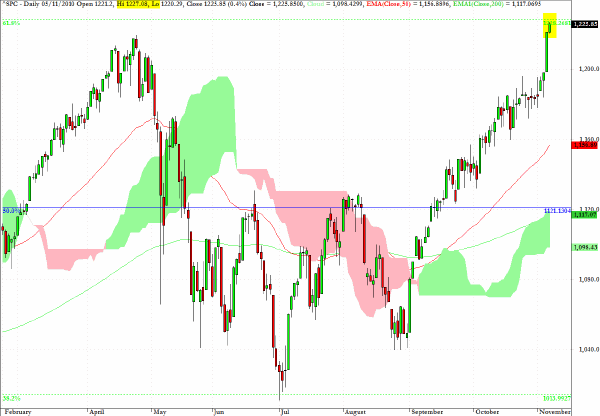
It is hard not to be bullish on risk assets when the declared aim of US monetary policy is the enhancement of a broad array of asset prices. As suggested here last week targets on the S&P 500 towards 1280 and beyond are now on the longer-term horizon.
It is worth acknowledging that, during Friday’s session, the high value registered on the S&P 500 cash index came within a whisker of the 1228 level which represents the 62% retracement level discussed here during the last few months.
The concern when looking at the charts for many individual equities and ETF’s is that they look over-extended after the run-up since early September, and, despite the recent jubilation over the QE2 decision, it would seem that a short term consolidation (at least) would be a healthy development for US equities.
With the BOJ now openly buying Japanese equities and REIT’s it is also not surprising that, having spent a few sessions teetering at the critical 9200 level, there is now a new dynamic propelling the Nikkei higher which enabled it to close Monday’s session above 9700 and at the highest level in three months.
When the Fed and the BOJ are acting, in effect, as "guarantors" of higher equity prices, it would not be the signature of a smart trading strategy to argue with them. However, the preferred posture would be one of choosing entry points that still provide scope, from either an Ichimoku cloud perspective or from strategic chart levels, for a more favorable risk/reward ratio than simply chasing everything that is making new multi-year highs.
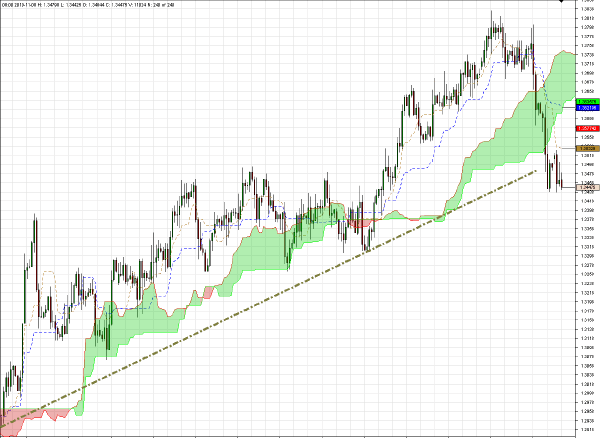
EUR/CHF is showing more signs of weakness and a potential break down, as anticipated in Friday’s commentary, and I would be looking for further declines over the next few sessions.
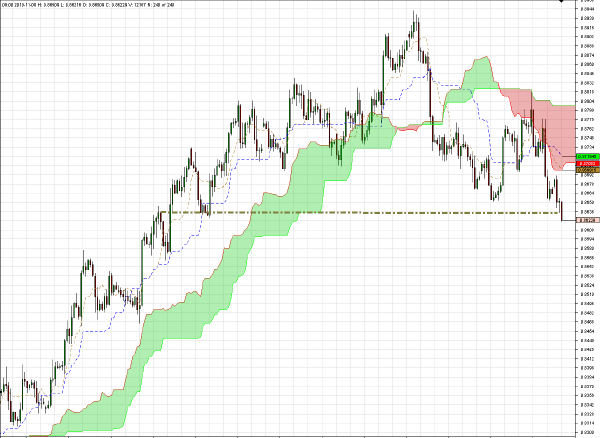
EUR/GBP also has broken below what appears to be a neckline and with problems in the peripheral EZ states unsettling the euro, UK sterling not only has the benefit of being outside the ECB monetary grid, but also, at least for the time being, of being the beneficiary of an economy which is showing more resilience than expected.
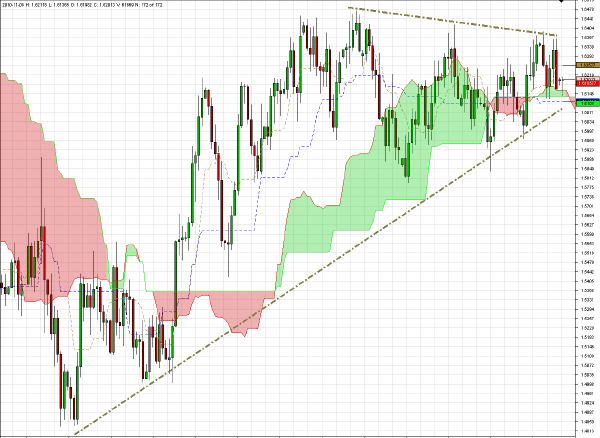
Despite my comments above regarding a preference for sterling against the euro, the daily chart for GBP/CAD would make me lean towards the short side, especially on a break below the very narrow Ichimoku cloud support on the right hand side of the chart. However, this would be a position trade with more of a focus on an extended holding period rather than as short term intraday play.
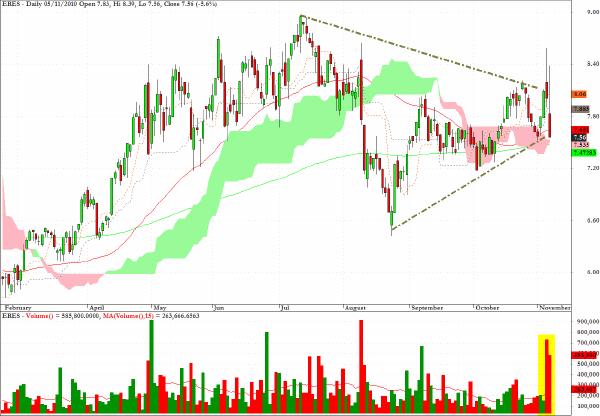
There are not many individual equities that I would be considering on the short side, but the chart for ERES looks vulnerable to further selling.
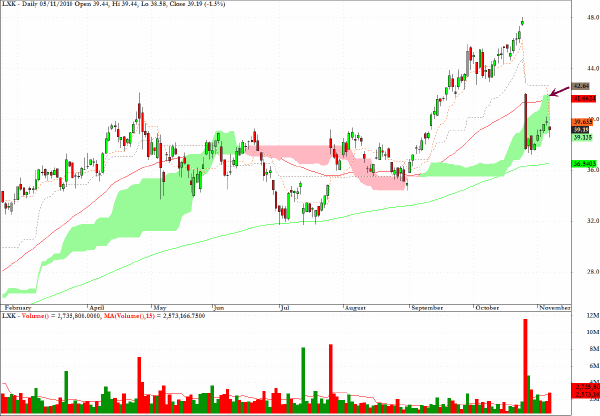
Lexmark (LXK) would satisfy the conditions for a bear flag pattern on a further pullback to the level indicated by the arrow on the chart below.
Clive Corcoran is the publisher of TradeWithForm.com, which provides daily analysis and commentary on the US stock market.
|