| Corcoran Technical Trading Patterns For November 29 |
| By Clive Corcoran |
Published
11/29/2010
|
Stocks
|
Unrated
|
|
|
|
Corcoran Technical Trading Patterns For November 29
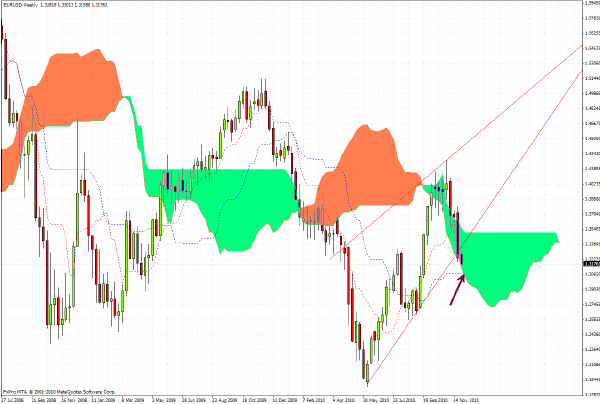
On the weekly chart for EUR/USD there is a case to be made that we should expect support around $1.3080 in the near term, but the big technical picture looks very weak.
I watched an interview last week in which Jim O’Neill from Goldman Sachs, who is clearly an astute observer of the markets but also renowned for his very upbeat views in general, made the case that the fundamental value for the euro is about $1.20. From a technical perspective it is also becoming more probable that the $1.18 level - seen during the earlier euro crisis this year - will need to be retested.
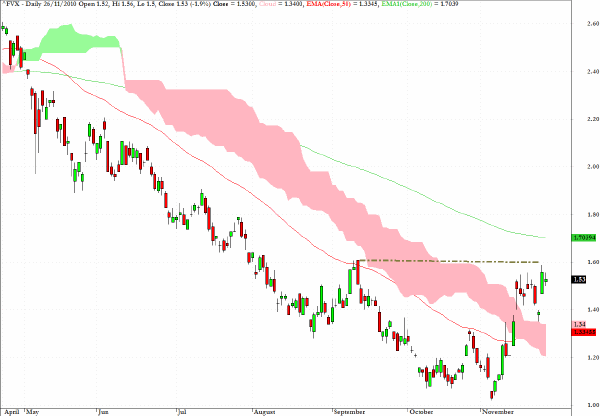
The yield on the five-year Treasury note may see a retreat in the near term based on safe haven buying amidst the woes of the Eurozone and sovereign debts of Club Med, but the technical formation is beginning to resemble a pattern which can often precede upward breakouts.
While on the topic of key interest rates, Bund futures are pointing to a lessening appetite for German government bonds and one spread worth monitoring closely is the differential between the 10-year bund and the 10-year UST.
Given the troubled outlook for the EZ one would expect German bond yields to continue moving higher relative to their US counterparts.
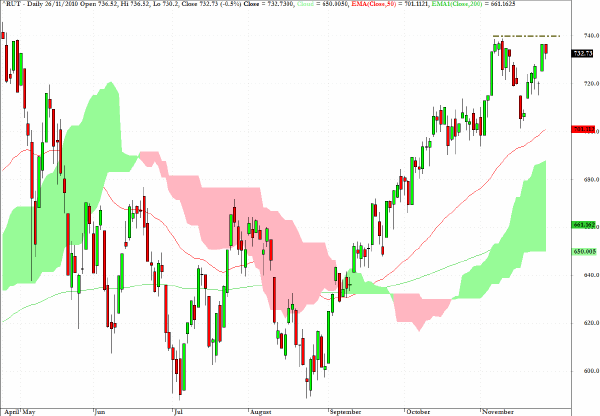
The resilience of US equities in spite of all of the headwinds within the global financial system and enhanced geo-political risk is quite revealing.
If the Russell 2000 can hold up and break above the 740 level, this would suggest that the April levels on the S&P 500 should be challenged again, perhaps before the end of 2010.
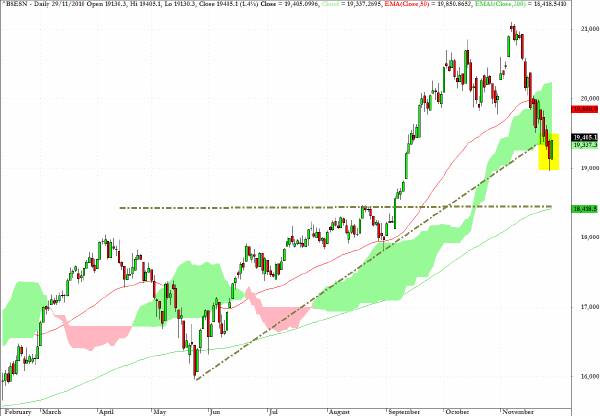
Indian equities, as expressed by the Mumbai Exchange have seen a rather abrupt retreat and despite today’s rally - which failed to take out Friday’s high - I would suggest that a visit to the 200-day EMA is likely in coming sessions.
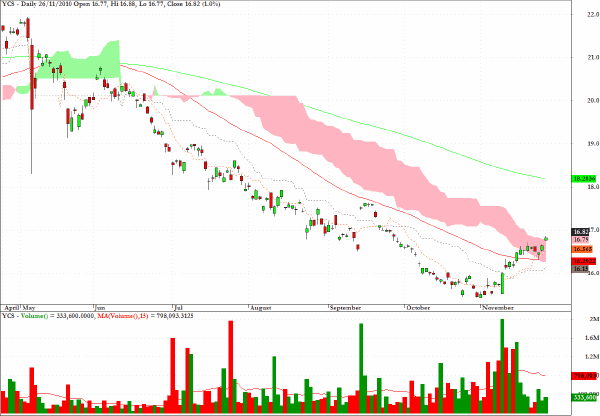
Here again are comments from the last time I discussed the exchange traded fund YCS.
The exchange traded fund YCS represents a leveraged vehicle which rises on yen weakness. I am not trying to call a bottom in the dollar/yen rate but I would say that for those with a longer-term horizon there are some technical suggestions that the US currency looks "sold out" against several currencies, and in particular the yen.
Sometimes with positional plays the risk/reward calculus favors being early rather than late as the downside on entry in this fund even three weeks ago was relatively limited and there is still plenty of scope for further advance by the US currency.
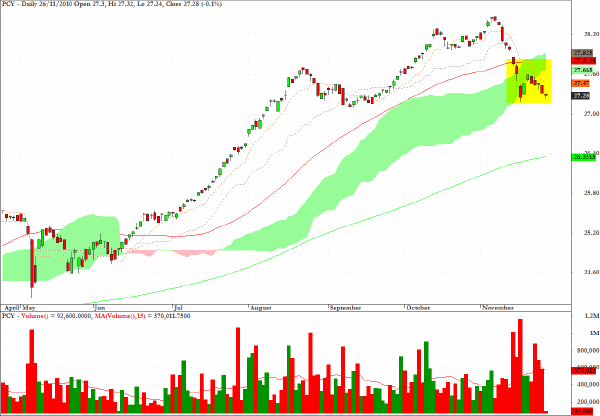
PCY, the exchange traded fund which tracks the sovereign debt from emerging markets, has continued its decline as anticipated.
Clive Corcoran is the publisher of TradeWithForm.com, which provides daily analysis and commentary on the US stock market.
|