| Corcoran Technical Trading Patterns For November 30 |
| By Clive Corcoran |
Published
11/30/2010
|
Stocks
|
Unrated
|
|
|
|
Corcoran Technical Trading Patterns For November 30
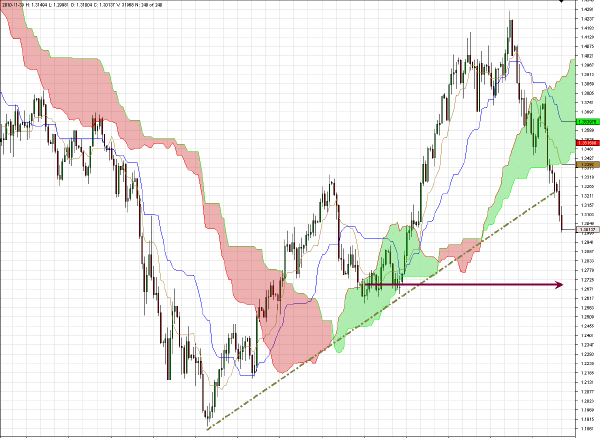
My target of 1.3080 provided a staging point for a short-term rally in EUR/USD in yesterday’s session but the selling resumed in Asian trading and in the European session we did break below $1.30, although at the time of writing we are still hovering in that vicinity.
The Eurozone mess just gets messier on a daily basis and the tectonic plates of systemic risks are grinding a little more than would make me comfortable if I had a lot of long exposure to risk assets. But POMO operations are a wonder to behold and Dr. Bernanke’s goal of "supporting" US equities suggests that it is better not to fight the Fed - at least by being short US equity index futures. POMO should keep a bid under the S&P 500, and as indicated here yesterday - the Russell 2000 remains near to the key 740 level - so for the time being fund managers can keep hoping that the combination of the Fed’s generosity and the ECB’s outright fear of financial panic in the EZ will allow us to muddle through as we often do.
In the meantime a careful monitoring of the sovereign CDS marketplace will provide a decent metric for measuring the likelihood of a major seismic event.
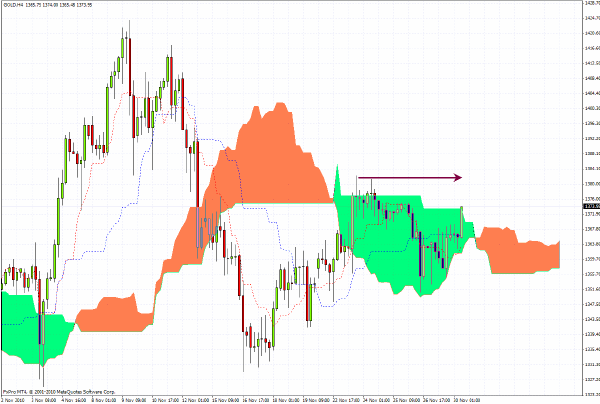
Spot gold has broken above the top of the Ichimoku cloud on the 240-minute chart and seems set to challenge $1383 - and this is despite a strengthening in the US dollar. Clearly the risk off mindset - some trading European bonds would call it slow motion panic - is encouraging asset allocators to increase their exposure to precious metals in case the unthinkable becomes the reasonably possible.
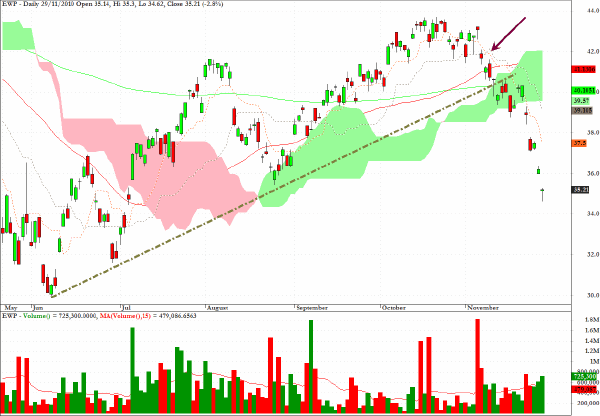
There are several ETF’s which allow for exposure to the peripheral Eurozone states such as EWP which is a tracker for Spanish equities and EWI which tracks the MSCI Italy Index (see below for the equivalent for France).
Reviewing the chart below, the series of gap down moves seems to have encouraged some buying interest but the arrow on the chart indicating a critical Ichimoku crossover on heavy volume provided a precursor to the glaring break of the trendline which occurred early in November.
The preferred stance toward this sector would not be to chase this down but to wait for a decent pullback and then take a short position with greater conviction as Spain’s real estate problems will be a feature of the rolling EZ crisis in the months to come.
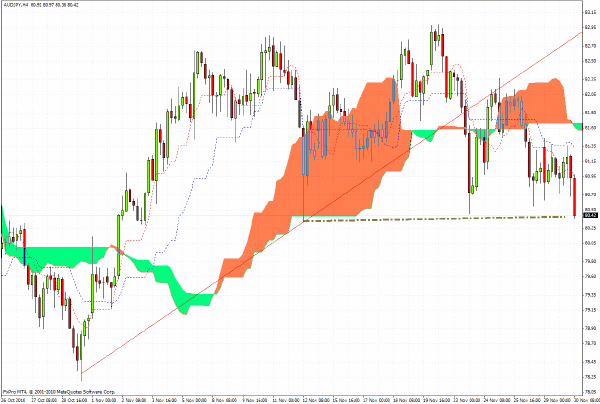
AUD/JPY is hanging on by its fingertips to the support level indicated on the 240-minute chart below.
As the larger frame technical picture suggests, the clear violation of the uptrend shows that further correction towards the 78 level is likely and the trading stance should be one of selling any rallies.
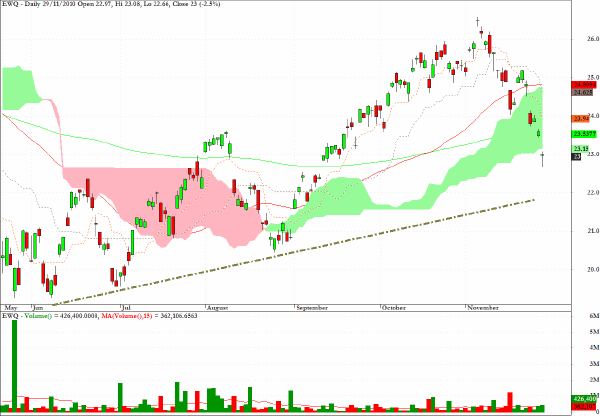
EWQ is an exchange traded fund which tracks the MSCI France index and seems to be headed eventually toward a test of the $22 level.
There are rumors in European trading on Tuesday morning that ratings agencies - perhaps S&P - are looking at issuing a negative outlook for the world’s fourth largest economy. This would put the French AAA rating at risk and further undermine the credibility of the AAA rating which the ineffable CRA’s gave to the European Financial Stability Facility (EFSF) back in the summer. Once again relying on the ratings from these agencies is proving to be hazardous to one’s wealth.
Just one further item which caught my attention this morning from a column by Ambrose Evans Pritchard was the following - "French lenders have $476bn of exposure to Italian debt, according to the Bank for International Settlements". At the time of writing the CDS rates for Italy were moving rather quickly in a direction which suggests that after Portugal and Spain it could be Italy’s turn to face the music.
Just to finish on this gloomy assessment for the EZ the following note from Nomura has been reported today and echoes the concern expressed here yesterday about German bunds
Initially the rise in Bund yields could have been explained by the coincident rise in Treasury yields post the QE announcement from the Fed. However, even this move, which is incorporated into the simple two-factor OLS model in Figure 1, is not enough to account for the rise in Bund yields. It now appears increasingly likely that the Bund has shifted correlation with the periphery and is now underperforming in unison with the periphery; the euro area debt markets are increasingly trading as one.
The negative tone with which the latest EU support package has been received by markets makes it increasingly clear that there is little the EU policymakers can do to calm markets in the short-term. So much confidence has been lost that it will take time to rebuild and the solution will likely involve further fiscal support from Germany.
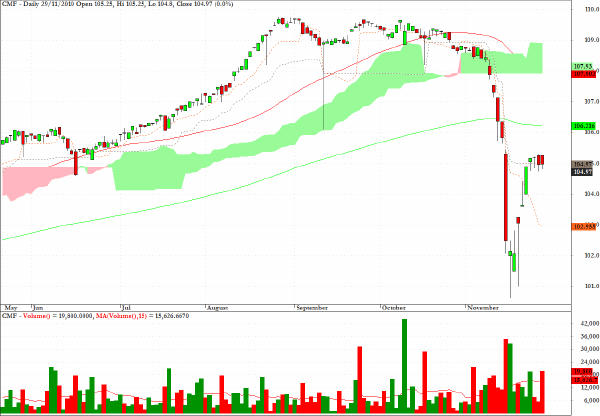
CMF, the exchange traded fund which tracks California’s municipal debt, may have pulled back enough for another attack of vertigo to unfold.
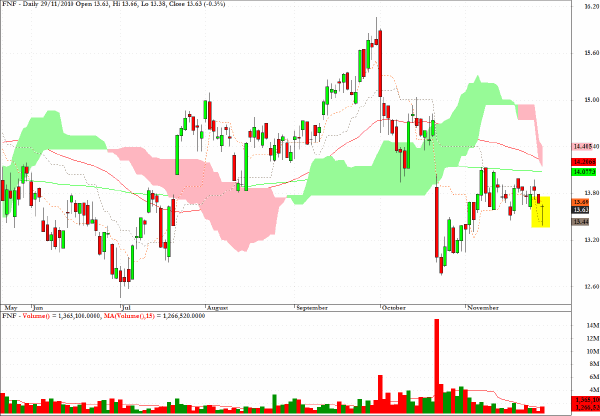
The chart for Fidelity National Financial (FNF) shows a tiny hanging man yesterday which could be the culmination of the pullback effort following the big sell-off in mid October.
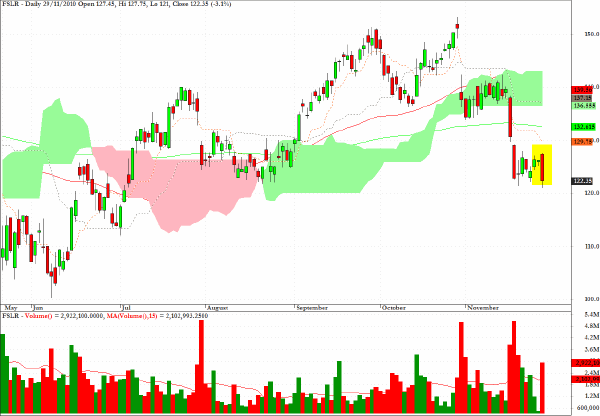
Another candidate for the short side among individual equities is First Solar (FSLR).
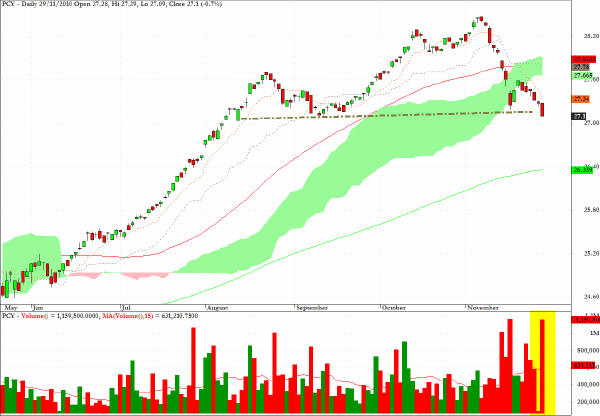
Not that I recommend this strategy carte blanche but regular readers will recall that I was early on my negative calls for PCY, the exchange traded fund which tracks the sovereign debt from emerging markets. In fact I lost a couple of times on premature short trades, but persistence has certainly paid off during November and the heavy volume yesterday which has brought the fund to a key level provided an excuse to cover half of the position but still with an anticipation of further gains in the intermediate term.
Clive Corcoran is the publisher of TradeWithForm.com, which provides daily analysis and commentary on the US stock market.
|