| The Wagner Daily ETF Report For November 30 |
| By Deron Wagner |
Published
11/30/2010
|
Stocks
|
Unrated
|
|
|
|
The Wagner Daily ETF Report For November 30
Bears dominated early trading as stocks plummeted at the open on Monday. All of the major indices traded down over 1.2% in the morning session. But at 10:00 am the markets stabilized and consolidated until the late afternoon. At the 2:30 pm reversal period, the markets staged an impressive reversal that lasted until the last 10 minutes of trading, at which point stocks were met with a volume-fueled wave of selling. For the session, the Nasdaq and the Dow Jones Industrial Average both fell 0.4%. The S&P MidCap 400 shed 0.2%, while the S&P 500 and the small-cap Russell 2000 almost made it back into positive territory. Both finished down a mere 0.1% for the day.
Turnover was up significantly compared to Friday's holiday shortened session. But on a relative basis yesterday's volume was modest, as it was unable to reach the 50-day volume moving average on either the NYSE or the Nasdaq. Nasdaq volume was up 164% day over day. Turnover on the NYSE closed up 103%. Declining volume outpaced advancing volume on both indices on Monday. The ratio was 1.1 to 1 on the NYSE and 1.5 to 1 on the Nasdaq.
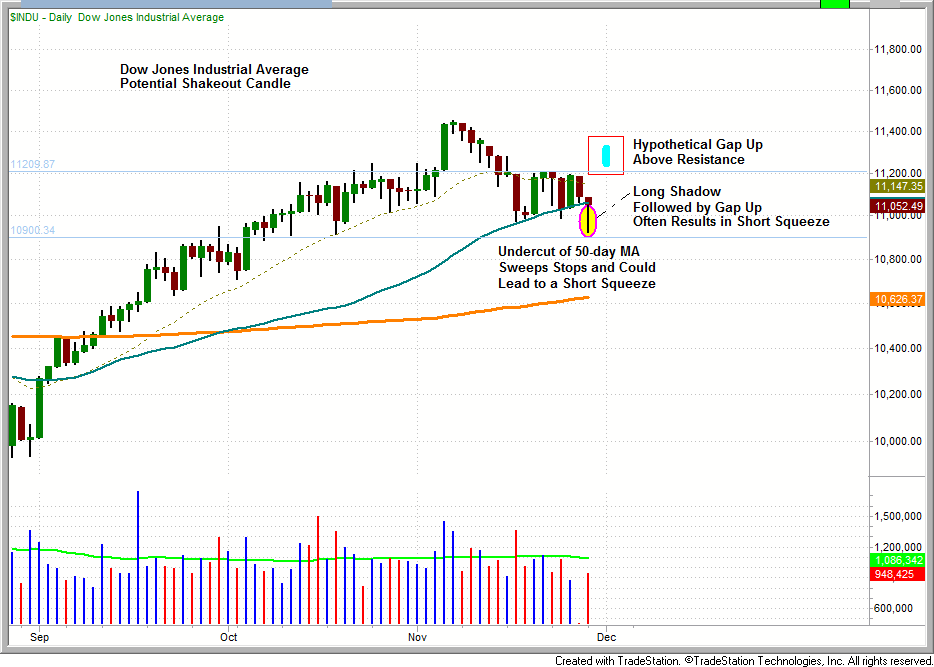
Yesterday's price action on the Dow Jones Industrial Average could qualify as shakeout move. It is not uncommon to see an undercut of a major moving average during a pullback in an uptrend. A decline below a key moving average that reverses quickly, "sweeps" the weak hands from the market and often results in a short squeeze that fuels the next advance. It is too early to tell whether or not this is the case for the Dow, but it does serve as an important signal that must be closely monitored. Under no circumstance do we trade from this signal in isolation. The price action over the next several days must be used in conjunction with the possible shakeout candle to determine whether or not the odds favor the resumption of the prevailing trend. For example, a big volume gap up at today's open would be a good indication that the uptrend may continue. A gap up after yesterday's reversal would likely create a state of panic among bears.

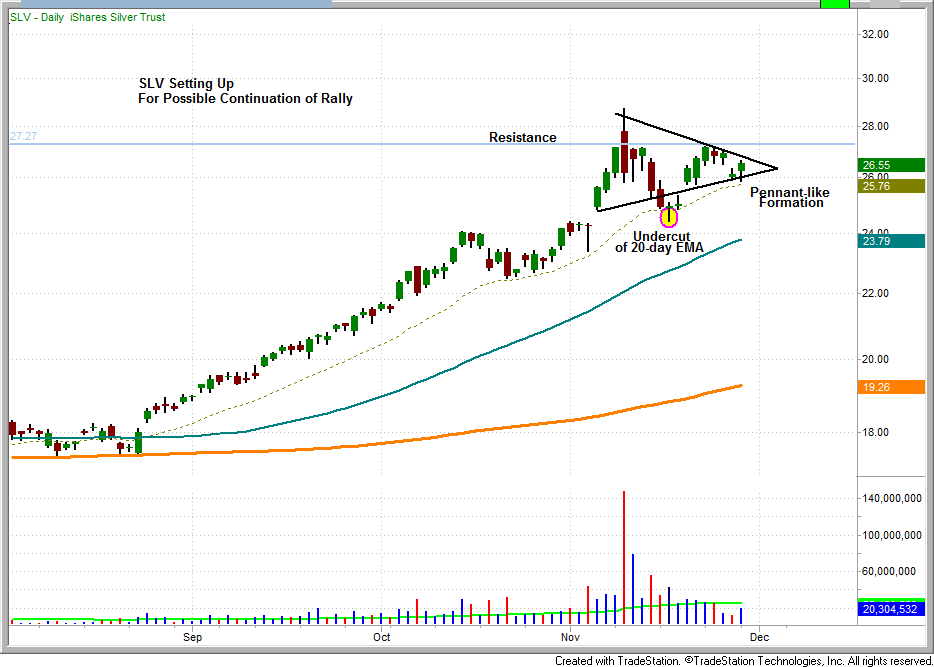
The iShares Silver Trust ETF (SLV) has maintained excellent relative strength during the most recent market decline. Over the past 17 trading days, this ETF has consolidated above the 20-day EMA and formed a bullish pennant-like technical pattern. Further, the undercut and subsequent gap-up above the 20-day exponential moving average provide evidence that SLV may be preparing for another advance. A surge above the November 22 high of $27.22 provides a possible long trigger for SLV.

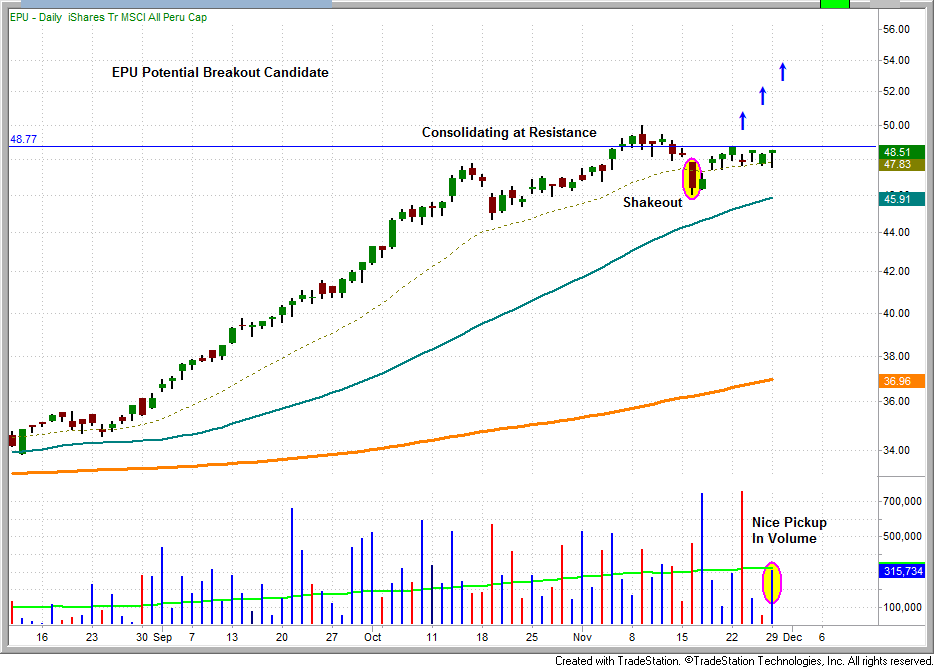
We are placing the iShares MSCI All Peru Capped Index Fund (EPU) on the watchlist. After a significant undercut of the 20-day EMA on November 16, EPU gapped back above this key technical mark two days later. Since then, EPU has consolidated for seven days in a very tight trading range. A breakout above the November 22 high of $48.71 provides a likely buying opportunity. For our subscribers, the details of this trade can be found in the watchlist portion of the newsletter.

For the ninth consecutive day, the market has exhibited a lack of direction. However, ETFs that have been leading the market responded appropriately by maintaining relative strength. Further, it can be argued that the strongest ETFs showed signs of institutional accumulation. These include oil services/related, precious metals, emerging markets and energy/related.
Deron Wagner is the Founder and Head Trader of both Morpheus Capital LP, a U.S. hedge fund, and MorpheusTrading.com, a trader education firm.
|