| The Wagner Daily ETF Report For December 1 |
| By Deron Wagner |
Published
12/1/2010
|
Stocks
|
Unrated
|
|
|
|
The Wagner Daily ETF Report For December 1
For the second consecutive day, the major indices gapped down to begin the session, but fought back to pare a significant portion of the intraday losses, only to dwindle into the close. Indecision was evident as all five indices closed near the middle of their respective trading rages on Tuesday. The Nasdaq led the drop, as it shed 1.1% for the day. The small-cap Russell 2000 was down 0.7%, while the S&P 500 and the S&P MidCap 400 both fell 0.6%. The Dow Jones Industrial Average demonstrated the most relative strength on Tuesday, but still closed down by 0.4%. All eyes are likely on the DJIA and the S&P 500 as both remain precariously perched at critical support levels.
Volume was up sharply on Tuesday. Turnover on the NYSE spiked 34% day over day. Nasdaq volume was also impressive, as it finished up over 18% in yesterday's action. For the second straight day, declining volume overshadowed advancing volume on both indices. However, the spread was somewhat wider yesterday. Down volume exceeded up volume by a ratio of 1.8 to 1 on the NYSE and 3 to 1 on the Nasdaq. Although leadership has not abandoned the market, yesterday did show pockets of distribution.
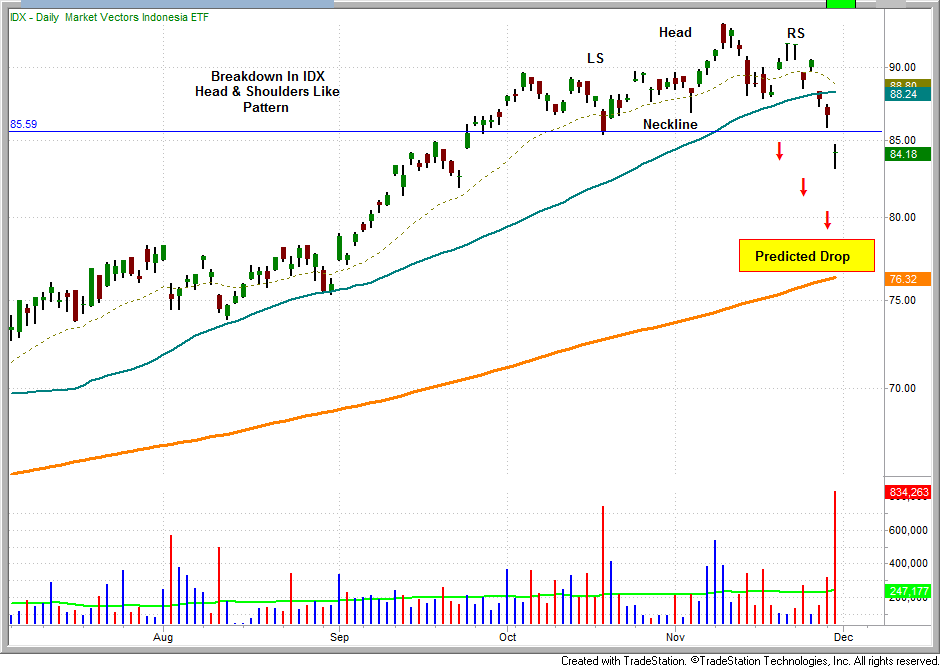
There are signs that emerging market ETFs may be losing some of their luster. On Tuesday, several of these ETFs lost support and many others are testing support. Head and shoulders reversal-like patterns are abundant in the emerging market landscape. While scanning for potential ETF plays last evening, over thirty such setups were found. The PowerShares DWA Emerging Markets Technical Leaders ETF (PIE), provides an excellent example. Over the past four days, this ETF has been consolidating below the 50-day MA. A break below the eight week low of $17.45 provides a potential shorting opportunity for PIE. PIE is also of interest since it "includes approximately 100 companies that possess relative strength characteristics, and are domiciled in emerging market countries, including, but not limited to, Argentina, Brazil, Chile, China, Colombia, Czech Republic, Egypt, Hungary, India, Indonesia, Israel, Malaysia, Mexico, Morocco, Pakistan, Peru, Philippines, Poland, Russia, South Africa, Taiwan, Thailand and Turkey". See Invesco Company website (http://invescopowershares.com) for further details. This ETF may be a good leading indicator as it provides key information on the status of market leaders. Typically, waning leadership foreshadows a downturn and vice versa.

The Market Vectors Indonesia ETF (IDX) presents an example of an emerging market ETF that has already broken down on the daily chart.

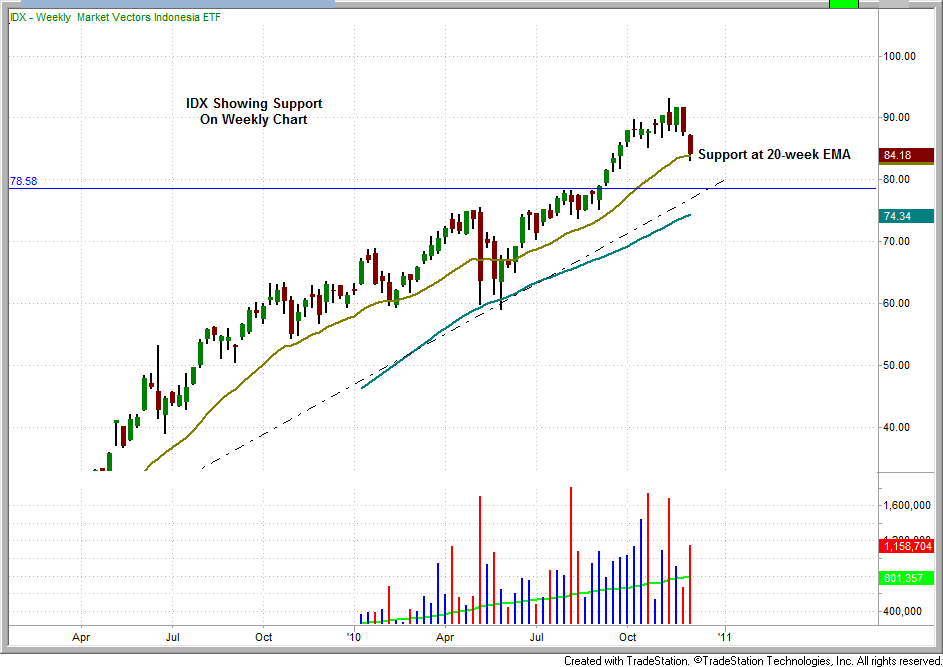
However, before deciding that strong ETFs are ready to implode, it is always wise to look at the weekly timeframe for further perspective (see below). The conclusion: it takes a volume enabled, powerful move to reverse a trend. A comparison of the daily and weekly charts of PIE and IDX lend quality information that might help explain why the markets have been choppy over the past two weeks.


The ProShares Ultra Short Emerging Markets ETF (EEV) provides a possible long entry above the November 29 high of $37.21. We are placing it on the watchlist. EEV has consolidated above the 50-day MA for the past four trading sessions. On November 29 it failed to break out on strong volume and ended up closing near the lows of the session. Yesterday, in whippy trading this ETF gapped up and managed to close near the highs of the day. Trade details are provided in the watchlist segment of the newsletter.

The SPDR Oil & Gas Exploration ETF (XOP) has maintained excellent relative strength to the market. A rally above the 4 day high of $48.64 makes XOP a potentially ideal long candidate. This ETF is also being placed on the watchlist.

We are inclined to place both long and short (inversely correlated) trades on the watchlist since the market is at an important inflection point.
Deron Wagner is the Founder and Head Trader of both Morpheus Capital LP, a U.S. hedge fund, and MorpheusTrading.com, a trader education firm.
|