| Corcoran Technical Trading Patterns For December 3 |
| By Clive Corcoran |
Published
12/3/2010
|
Stocks
|
Unrated
|
|
|
|
Corcoran Technical Trading Patterns For December 3
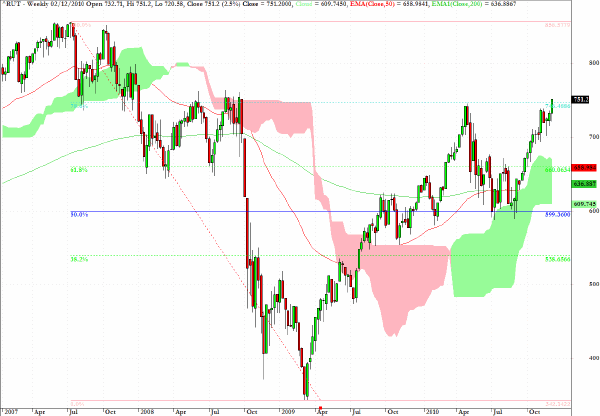
Before moving to the 30,000 foot macro level it is worth contemplating the startling weekly chart below for the Russell 2000 index. I have expressed the view here recently that, despite the seismic rumblings within systemically important markets such as that for sovereign CDS’s and European banks, the ability of equities, especially US equities, to find a silver lining to every cloud has been remarkable.
As anticipated here in Wednesday’s commentary, the S&P 500 looks about to challenge the critical 1228 level and meanwhile the Russell 2000 has now broken away from the pivotal 740 level and peeked above the 78% retracement level from the multi-year high/low seen on the chart.
In harmony with the view that the big macro funds are less focused on generating alpha than ever before, the name of the game is increasingly one of seeking out beta when the risk-on dynamics are in ascendancy. For the time being, the micro caps are proving themselves up to the task of delivering high returns when the bulls are controlling the agenda and the targets for the index must clearly be on attempting to regain a footing above 800 with a view at the 845 level last seen in October 2008.
Having said that, high beta assets is not where one wants to be when the risk-off dynamics return and I am reminded of a comment which I made earlier this year at my blog site.
More and more we have markets that go up primarily because of short covering by over-zealous bears who get too confidently pessimistic during the RISK OFF phase of the game, and go down when the hedge funds enjoying the RISK ON phase get too enthusiastic, and then stare at each other wondering where the next punter is to whom they can unload their positions.
As referenced in a blog posting here, almost exactly one year ago, we had better get used to increasingly bipolar capital markets.
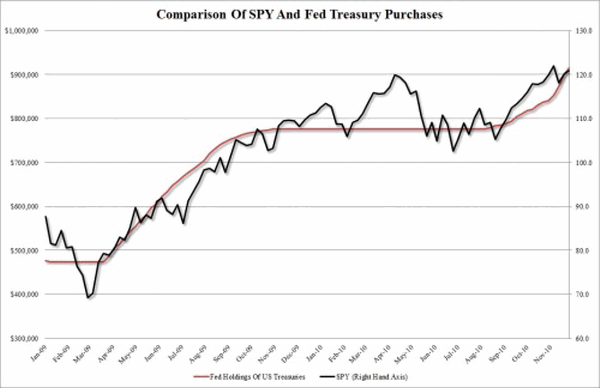
Several readers of the Daily Form commentary have queried the nature of POMO operations and asked specifically how sustainable is the rally in US equities which is predicated on the ongoing purchases by the Fed from the elongated QE program.
The chart below appeared at the zerohedge.com website and illustrates graphically the striking relationship between the ratcheting up of the Fed’s holdings of UST’s on its balance sheet on the left hand scale and the concurrent movements in SPY as illustrated on the right hand scale.
Sometimes clever use of graphics can make relationships seem too neat and tidy but there is undoubtedly a case to be made that the Fed can claim "Mission Accomplished" in its recent declaration that supporting higher equity prices has become a goal of current monetary policy.
In terms of how much longer this can continue my suggestion would be that the "beneath the surface" switch out of euro denominated assets and also away from fixed income instruments will provide further support for US equities as long as policy makers can perform the conjuring trick of remaining generous in providing an almost endless stream of liquidity and at the same time holding together (or preserving that illusion) that they have not lost the plot in managing fragile public balance sheets. In other words the rally could last a lot longer, but when it fails it could fail with rather unpleasant consequences.
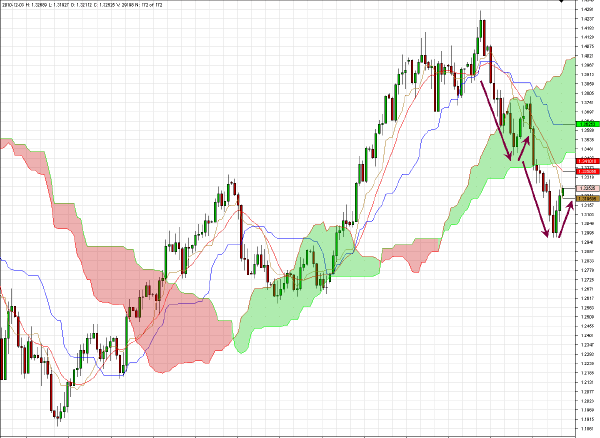
The daily chart for EUR/USD reveals a reasonably simplified wave count for the EZ currency showing that the current rally may be close to completion of a wave 4 counter-trend move to be followed by a further wave 5 decline.
From a fundamental perspective the recent price action is explicable by the widely acknowledged view that there has been substantial covering in the last 48 hours of very large short positions established over last week and early this week when there was an exceedingly pessimistic view on the imminence of a currency crisis. That may well lie in our future but short covering was also precipitated by some well chosen weasel words from the ECB’s Jean Claude Trichet in yesterday’s ECB press briefing.
Sometime soon I would expect a re-testing of the $1.30 level with an intermediate-term target (i.e. in the next week or so) of $1.2780.
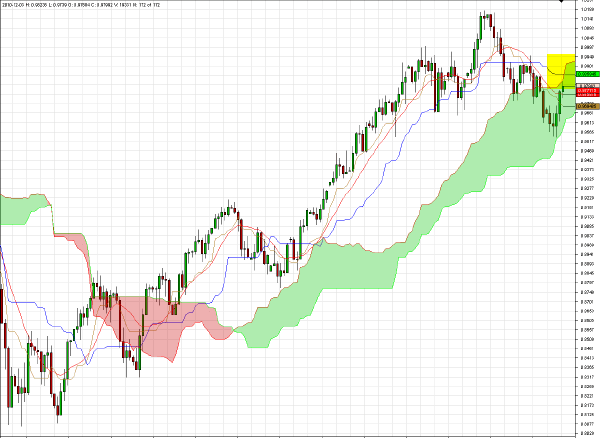
I shall restate my view from earlier this week on the outlook for the Aussie dollar as recent price developments have been pretty much in accordance with the comments expressed.
AUD/USD has bounced off the bottom of the Ichimoku cloud on the daily chart below and the positive news from China overnight could well help to re-energize the Aussie currency over the next few sessions - especially if there is a respite in the EZ crisis.
In the intermediate term the larger technical picture suggests that the level indicated on the chart around 0.9400 seems to be a likely target when the pullback phase has run its course.
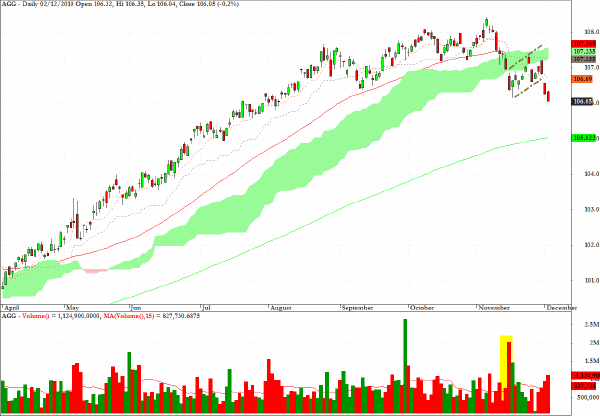
AGG which tracks returns on investment grade corporate bonds is revealing further corrective behavior following the break down from a bear flag pattern. A feasible longer-term target would be for prices to retreat to the 200-day EMA (green line on the chart).
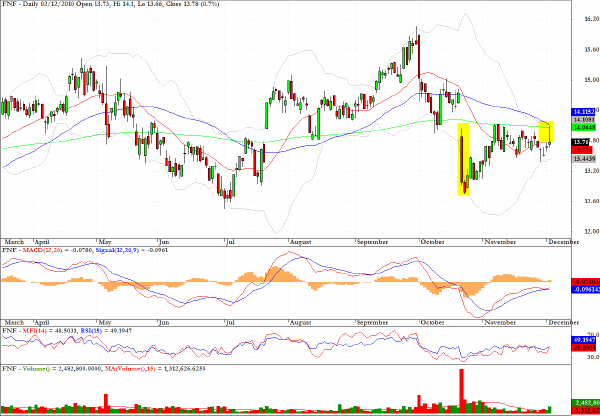
The bias towards the short side remains for the technically weak chart pattern for Fidelity National Financial (FNF).
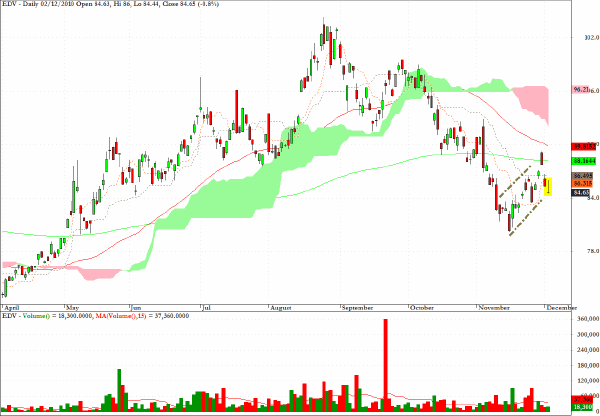
EDV represents extended duration US Treasury strips and the suggestion made here in November that pullbacks might appeal to those believing that this is where the most pain should be expected and where entry opportunities on the short side are most appealing, would now be worthy of consideration.
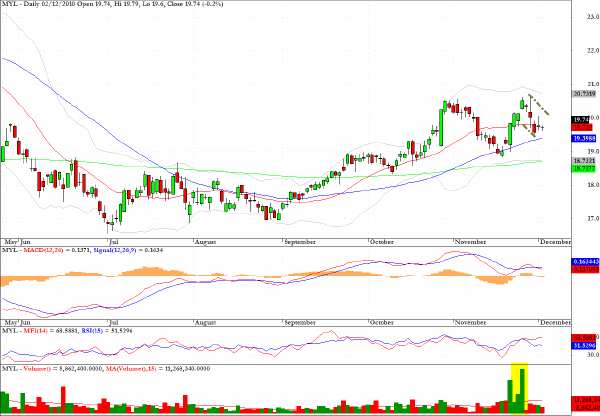
Mylan Laboratories (MYL) has a combination of bull flag characteristics as well as a cup/handle formation and the long side would be appealing from a reward/risk perspective.
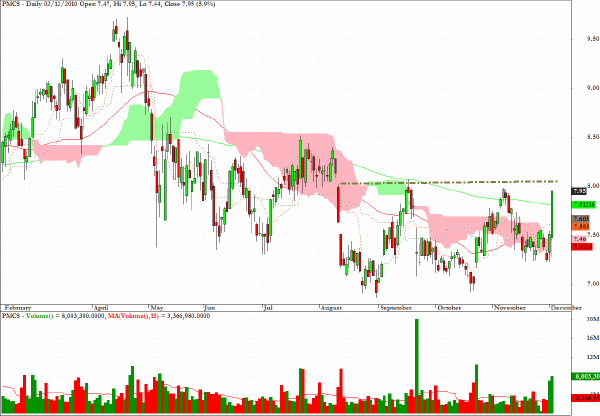
PMCS, a semiconductor stock, made substantial progress in yesterday’s session and the volume over the last two sessions illustrates again that plays on momentum and beta are driving the equities rally. There could be some need for consolidation around the $8 level before the rally is extended but as we move into the latter part of the year this stock, once it breaks away from the basing pattern could be headed back to the April high.
Here is the comment from Tuesday’s commentary.
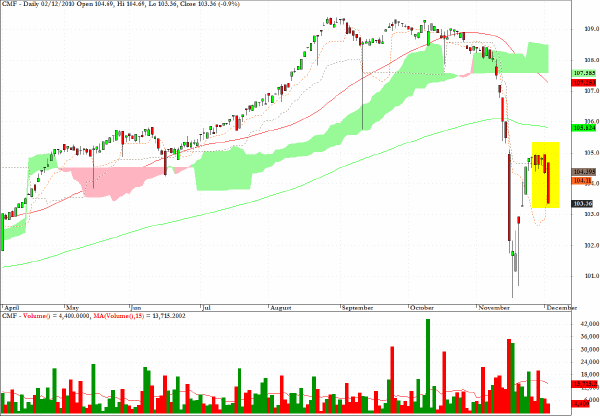
CMF, the exchange traded fund which tracks California’s municipal debt, may have pulled back enough for another attack of vertigo to unfold.
Clive Corcoran is the publisher of TradeWithForm.com, which provides daily analysis and commentary on the US stock market.
|