| Corcoran Technical Trading Patterns For December 6 |
| By Clive Corcoran |
Published
12/6/2010
|
Stocks
|
Unrated
|
|
|
|
Corcoran Technical Trading Patterns For December 6
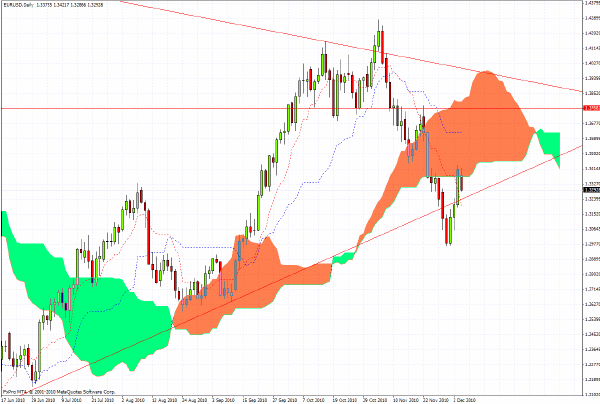
The daily chart for EUR/USD from an Ichimoku perspective is quite revealing as it shows that the EZ currency met rejection at almost exactly the point anticipated. After peeking into the cloud and reaching the $1.34 level the rate has retreated below the cloud and, at the time of writing, is now sitting close to $1.33.
As can be seen on the chart, another break below the upward sloping trendline not far below the current exchange rate would validate the five-wave interpretation given here on Friday and suggest that the $1.30 level is back in play.
Fundamentally there are several items that are playing into the double bind issues which confront a resolution of the severe architectural flaws of the EMU mechanism.
An interesting piece at the FT Alphaville website has pointed out that the plans to replace the EFSF, which has a built in termination date of June 30, 2013, with a new European Stability Mechanism (ESM) is facing legal/conceptual hurdles because, according to the wishes of the Germans, new debt issued from the ESM vehicle would have "preferred creditor" status and seniority over existing debt. Apart from the obvious issue that this will simply reinforce the buyers’ strike (apart from the always reliable ECB that is) for existing instruments, the further problem is that by insisting on seniority for the new debt it is conceivable that default/restructuring clauses could be triggered in a variety of CDS arrangements.
Not only could there be another rush to the exits for eurobonds (as the demarcation between sovereign issues and other structured instruments is becoming increasingly blurred) but there could also be a rush to the courthouses. This is making the EU mess even messier.
The second problem, which will almost certainly lessen the appetite for further political/fiscal integration of the EZ is that the 10 year bund yield keeps moving higher and is approaching the yield on the equivalent UST. This remarkable phenomenon will not go down well with German policy makers or their electorates and may hasten the day when the consensus view within Germany is to return to the Deutschemark.
Over the weekend a poll by a major German TV network found that almost 60% of Germans would now like to see Germany abandon the euro and return to their much loved former currency. For the technocrats in Brussels this may well be, to use a wonderful American expression, where the rubber meets the road.

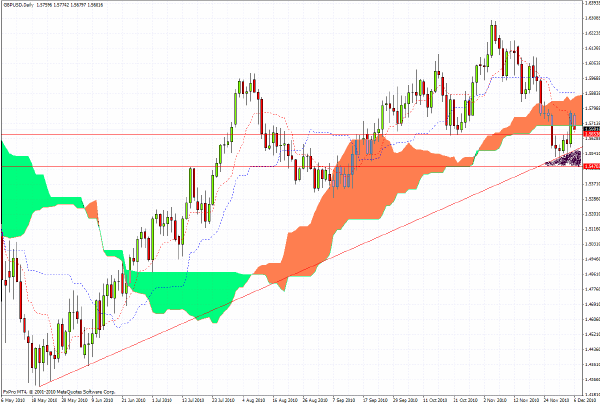
In Friday’s commentary I remarked that "GBP/USD should encounter resistance around the level indicated by the arrow on the daily chart i.e. $1.5750."
The daily chart for sterling against the dollar is quite complex showing that the shaded area could well provide a zone of support for the currency - especially if the euro comes under attack again - but that a decisive break below the shaded area opens up a chasm which could see the currency back in the low $1.50’s

The weak NFP data on Friday was interpreted by many market participants as good for equities as it should prolong and enhance the Fed program of QE which, according to the stated aim of chairman Bernanke, has, as one of its main objectives, the propagation of the wealth effect through outright support equity prices.
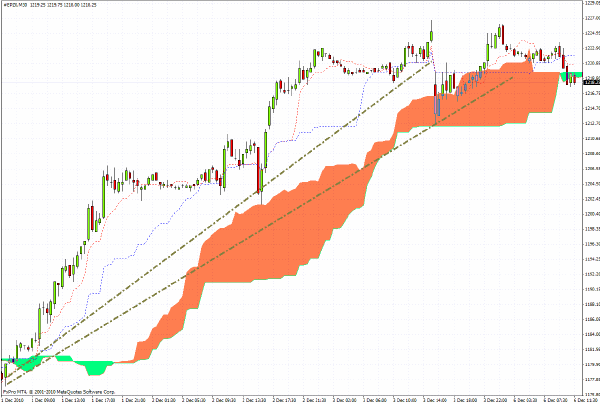
The 30-minute intraday futures chart for the S&P 500 e-Mini on Monday in Europe is showing signs of weakness as trend lines are being violated, and the next two days could see a return of risk off while the EU debates the future mechanisms to save the euro, but I still retain my bullish stance towards US equities as long as we do not see a real buyers strike in UST’s.

Another major beneficiary from the combination of the weak NFP data and the corollary which strengthens the case for even more enlargements to QE, has been gold.
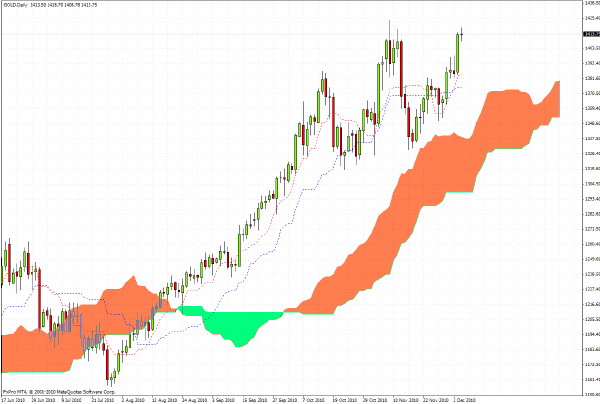
Spot prices are around $1415 in European trading on Monday morning, holding on to most of the gains which came during the US session on Friday after the release of the NFP data, and the formation on the daily chart is evolving as a fractal version of the pattern which preceded the major breakout move up in the metal in October 2009.
The pattern could well see another pullback but if that move down proves shallow then two variants of related patterns i.e. a cup/handle and an inverted H&S pattern, could well be the precursors to another move up towards the $1650 level.

Clive Corcoran is the publisher of TradeWithForm.com, which provides daily analysis and commentary on the US stock market.
|