| Corcoran Technical Trading Patterns For December 8 |
| By Clive Corcoran |
Published
12/8/2010
|
Stocks
|
Unrated
|
|
|
|
Corcoran Technical Trading Patterns For December 8
In Monday’s commentary I inserted the following qualification in regard to the S&P 500 -- "I still retain my bullish stance towards US equities as long as we do not see a real buyers strike in UST’s."
Describing yesterday’s sell-off in US Treasuries as a strike would be an exaggeration, but the penny may finally be dropping with large institutional holders that at some point the Fed may not be able to maintain its current facade of being the buyer of last resort for the mountains of public sector debt that are required by Washington policy makers. When that realization becomes even harder to ignore there will be a choice to be made - either hold the bonds till maturity on the self-deceptive belief that they represent solid assets with predictable cash flow or rush for the exits in a collective panic which might have some rather unsavory characteristics.
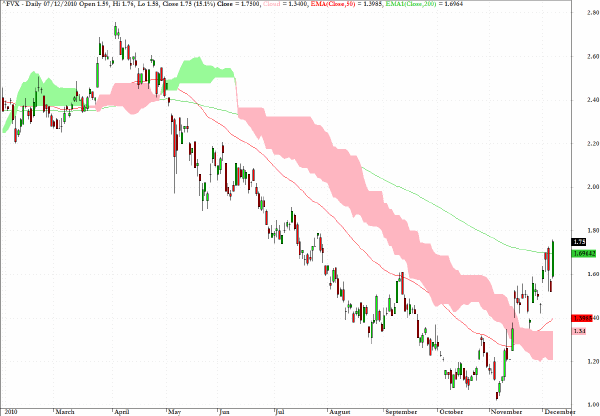
The chart below for the yield on the 5-Year Treasury note shows quite an extraordinary jump in yields since QE2 was ratified and may be sufficiently worrisome that Dr. Bernanke may have had to update his nightly sedation medications. In these very politically correct times I should hasten to add that the last bit of that sentence was just joking as I have no idea whether the Fed chairman needs assistance to fall asleep, and nothing implied either directly or indirectly, was intended to cast aspersions on his health, well-being or suitability for the role he occupies etc...
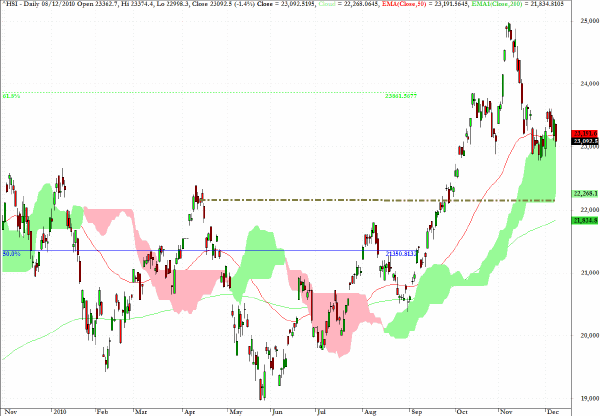
The chart for the Hang Seng Index suggests that there is potential for a return to the 22,250 level as illustrated by the dotted line on the chart and provides further grounds for being more cautious with regard to risk assets in general and China/EM plays in particular.
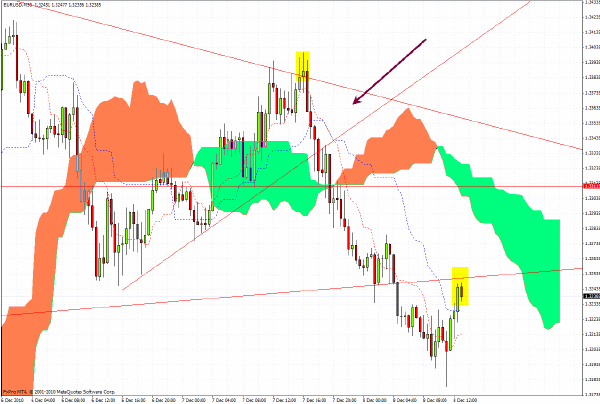
EUR/USD has been relatively easy to trade over the last 24 hours and the arrow on the 30-minute chart indicates the apex of a triangle which required a directional decision, and where the overall chart patterns from a wave perspective suggested that this would be downwards.
The current level around $1.3240 shows that this could pose a potential rejection level and as the pair move further towards the right of the chart the shape of the cloud formation suggests that a retest of lower levels is feasible.
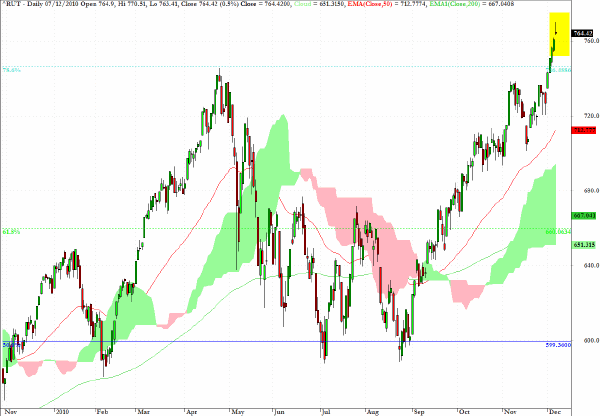
A number of key daily charts are displaying shooting star and even gravestone doji candlesticks following yesterday’s North American session.
The Russell 2000 chart is of particular interest as it also reveals a gap opening at a multi-period high. If the risk off dynamics begin to re-assert themselves, which remains a big if when the Fed is being so generous, then the higher beta of the micro caps will work to the advantage of the short seller relative to a long position on the large caps via the S&P 500.
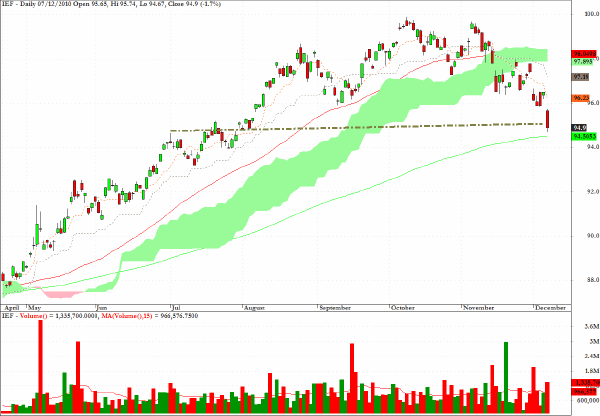
IEF, an exchange traded fund which allows access to prices of UST’s in the 5-7 year maturity range has been tumbling in line with the uptick in yields on the 5-year Treasury note discussed above.
From the chart configuration there is a suggestion that a support level may be near at hand and, as with much trading activity at present, the zeal with which sellers emerged in the Treasury complex yesterday looked a just a little overdone.
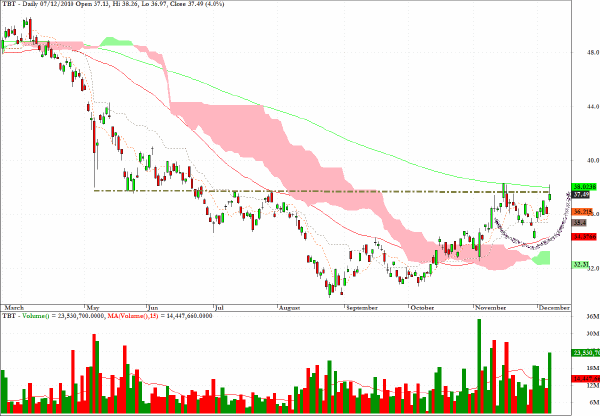
The chart for TBT, which moves in tandem with increased yields on long-term US Treasuries, would be the preferred way to be positioned for those who share the view that we are witnessing a gradual ending to the long bull market in UST’s.
One of the benefits and risks of maintaining an archive of previous commentaries is that it enables readers to examine retrospectively the merits of comments made in these columns.
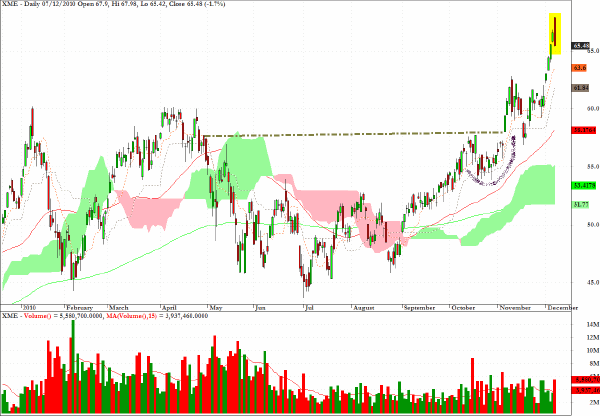
The last time I discussed XME was on November 5 and can be seen here . At the time I suggested that this was a preferred long candidate given the chart formation (cup and handle) which has been annotated again.
Following yesterday’s nasty looking red trend day candlestick I would now suggest withdrawing to the sidelines for this sector.
Clive Corcoran is the publisher of TradeWithForm.com, which provides daily analysis and commentary on the US stock market.
|