| Corcoran Technical Trading Patterns For December 10 |
| By Clive Corcoran |
Published
12/10/2010
|
Stocks
|
Unrated
|
|
|
|
Corcoran Technical Trading Patterns For December 10
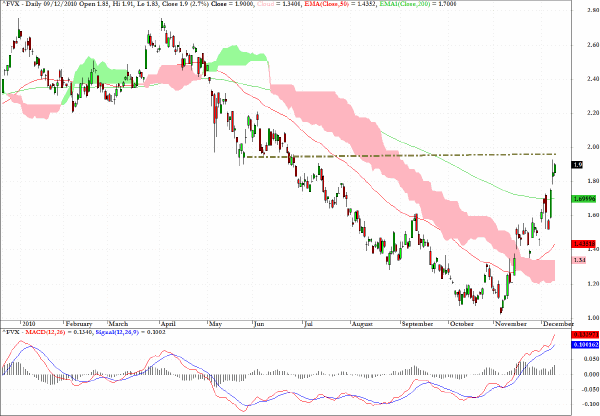
If the yield on the Five Year Treasury note moves up towards the dotted line of potential resistance indicated on the chart, which more or less coincides with a yield of two percent, this mid-spectrum instrument will almost have doubled in just six weeks.
The yield curve is clearly a lot flatter today than it was six weeks ago which is to be expected at this stage in the flight from safety, but in my estimation, if the long-term bull market in UST’s is drawing to a close there is likely to be a more steady attrition in price at the longer end of the maturity spectrum as the correction unfolds.
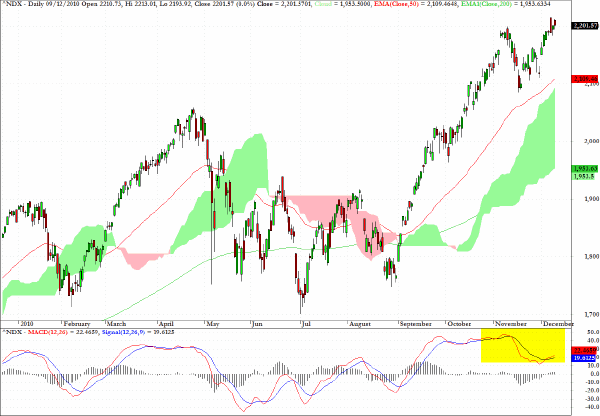
Despite underlying concerns from the selloff in fixed income assets, the ongoing uncertainties about the situation with respect to the Eurozone and the outlook for inflation problems in Asian markets, US equities are showing remarkable resilience.
Having said that, one has to remember that current equity markets in the US are less about price discovery and more about the benefits of POMO.
While it may be ungracious to point this out when everyone seems to be so enamoured with equities, the Nasdaq 100 index is revealing a very pronounced negative divergence from a MACD perspective. However, as could be seen in the extended period of bullishness in late 2007 and even in mid 2008 the market can go a long time exhibiting such symptoms of dissonance before any damage is done. And one has to recall that those periods were without a super generous asset purchase program being administered on almost a daily basis by those kind folks at the Fed.
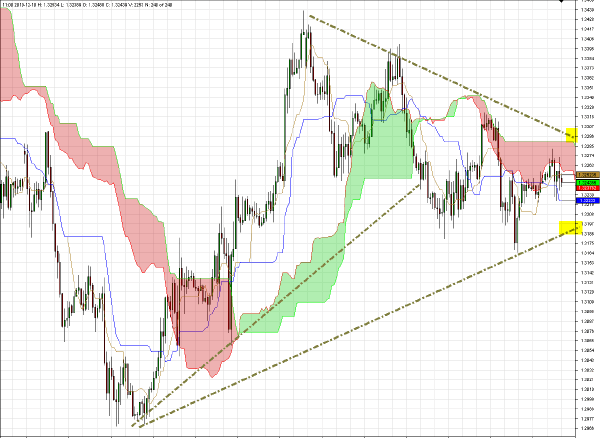
EUR/USD is entering the sharp end of a triangular formation with $1.33 as an upward bound and $1.32 as a lower bound.
The clear trendline through the highs on the right hand side of the chart is causing me to lean towards a drop below the $1.32 level. However, the euro bond markets are closing down for the year and with thinning liquidity in coming weeks in the FX markets there really could be some wild gyrations in the exchange rate, and I am confining my activities to short term trades with a bias towards selling rallies when key Ichimoku levels are touched on the 15 and 30-minute charts and taking profits (or losses when I get the trades wrong!) quite quickly.
I have written an extended piece on the Eurozone’s current crisis and likely future course from my perspective which can be found here.
One of the themes of that piece is to discuss the potential for fallout from further deterioration in the outlook for the German bund. It could well be argued that German government bonds have consistently been the most reliable sovereign credit instrument over the last 20 years (or more). We shall have to see when traders return in 2011 to dealing with dire condition of the EZ’s peripheral public finances just how much the fact that Germany’s credit standing, being the principal underwriter of the EZ safety net, may become tainted by the inferior credits of most of its fellow EZ members.
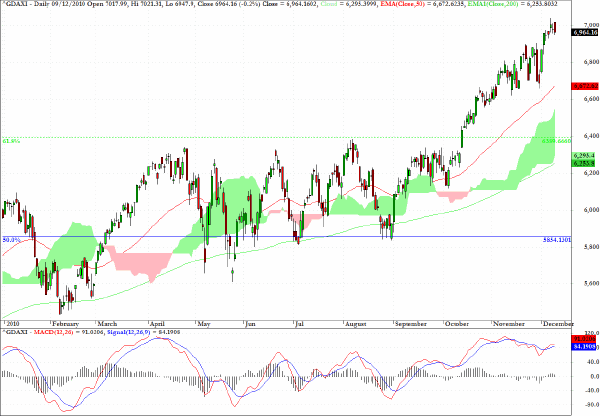
Meanwhile the DAX index is racing ahead again, and stands above 7000 in European trading on Friday morning as this is being written, so once again it feels a little grumpy to be pointing to the discordant formation on the MACD segment below.
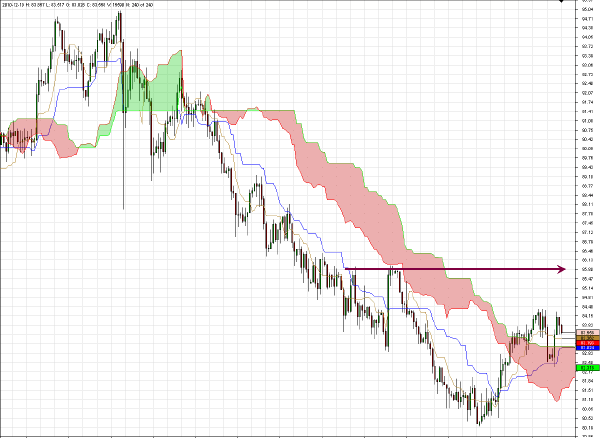
USD/JPY has cleared above cloud resistance on the daily chart and the basing pattern revealed suggests that an intermediate-term target of 85.80 is feasible.
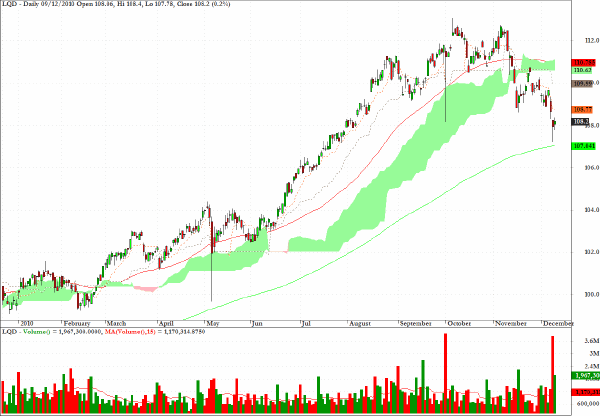
I last commented on LQD, a fund for investment grade corporates, and noted the drop below the cloud formation. Following the pullback and failure to re-enter the cloud the fund has dropped in line with the correction now being seen in most fixed income instruments.
While I would still favor the short side, the proximity to the 200-day EMA to yesterday’s close could see a small respite from the selling, but the trading stance towards the numerous fixed income ETF’s (some of which track yield and can be purchased as longs or if they represent price they should be shorted) is moving now to one of selling any rallies in the price of most bonds.
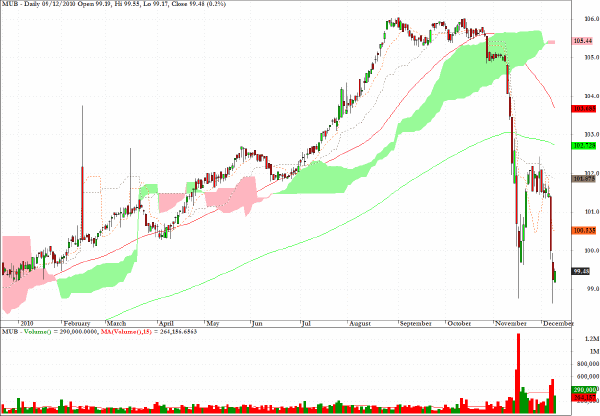
The chart for MUB reveals the dramatic drop in the market’s appetite for municipal debt within the US and although the chart pattern suggests that a bounce off a double bottom may be likely in the near term, as just suggested in connection with LQD, the appropriate posture would be one of seeing rallies as selling opportunities.
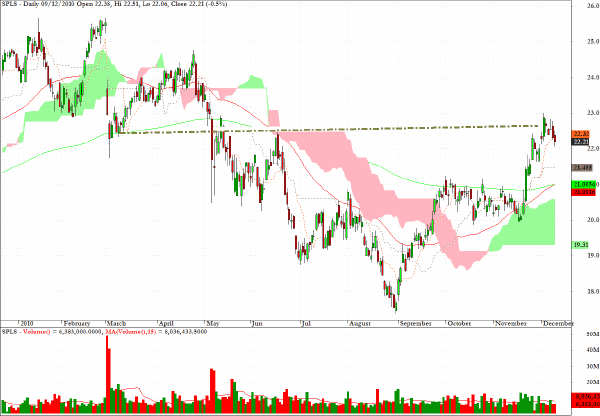
Staples (SPLS) reveals the early stages of a cup/handle pattern at a key level and also as the 50-day EMA is seen crossing the 200-day EMA from below following yesterday’s session I would be inclined to look for long entry points during the next couple of sessions.
Clive Corcoran is the publisher of TradeWithForm.com, which provides daily analysis and commentary on the US stock market.
|