| Corcoran Technical Trading Patterns For December 15 |
| By Clive Corcoran |
Published
12/15/2010
|
Stocks
|
Unrated
|
|
|
|
Corcoran Technical Trading Patterns For December 15
Monday’s commentary included a discussion of the rather troublesome deterioration in the Spanish government bond market, and this has proven to be somewhat timely as Moody’s has today announced that it has put Spain on credit watch with a possible downgrade ahead. This has been accompanied throughout the Wednesday morning session in Europe with the usual denials that there is any risk of Spain needing assistance, intermingled with various suggestions from EZ officials that they are preparing to enlarge the various bailout mechanisms.
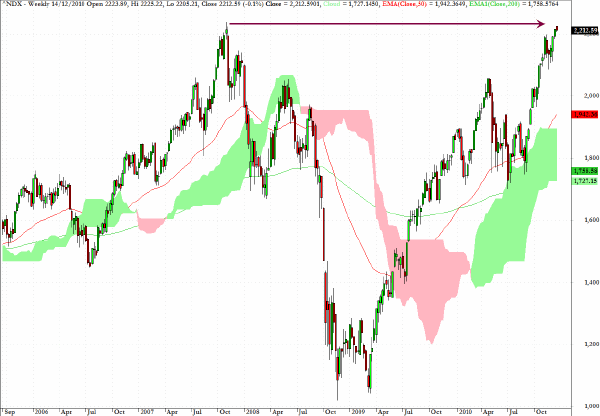
The weekly chart of the Nasdaq 100 index shows that the index has now closed at almost exactly the level from November 2007 and raises the prospect that a double top pattern - at least from an interim perspective - could unfold. Meanwhile, as noted here many times recently, US equities continue, with the support of vast amounts of POMO, to blithely ignore many kinds of potential contagion risk from the partly insolvent EZ, the muni bond market meltdown, rising inflation and a sell off in all kinds of bonds.
Such resilience is hard to challenge and one could put it down to a combination of both the wisdom of not fighting the Fed, and to the fact that all of the money which is now exiting fixed income asset funds is looking for more adventurous opportunities in equities.
While I am still expecting higher equity prices ahead in 2011 - until and unless the EZ disintegrates - the near-term risks of a sharp correction are rising and to that extent I remain flat on exposure to US equities.
In Monday’s commentary I suggested that the pattern on the EUR/USD hourly chart pointed to a descending wedge pattern which I thought would break to the downside. I also attached a relatively low probability to the fact that if the wedge was broken to the upside that we would go back and retest the $1.3480 level.
As it turns out, my less probable scenario unfolded yesterday in exactly that fashion, and once I had lost enough by shorting rallies, and became convinced that the euro would head back to the most recent highs, I was able to gain more profits than I had lost earlier in the day. This shows that one needs to be prepared to abandon strategies quickly in trading FX, especially when - as with wedge/triangle patterns - the breakaways become firmly directional.
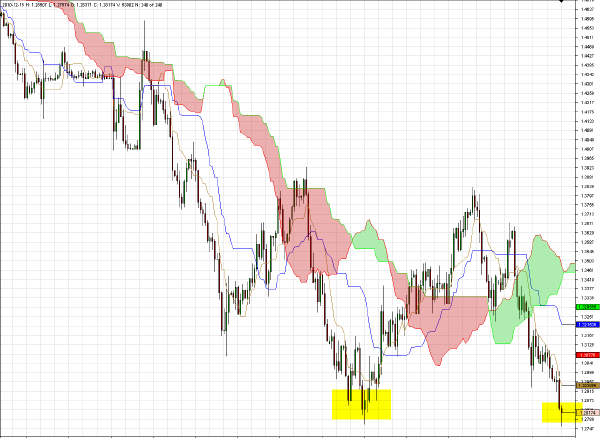
The daily chart for EUR/CHF below shows that the euro faces a key test of the lows against the Swiss franc, and while a near-term bounce is likely, the amount of capital flows into the Swiss currency from anxious European investors and institutions suggests that another leg down is a distinct possibility.
When large scale bond trading resumes in the new year I would expect the increasing difficulties for the EZ to re-emerge with a vengeance and if the problems of Spain take center stage the manner in which this economy, much larger than Greece, Ireland or Portugal, can be rescued will become a massive headache for EZ policy makers.
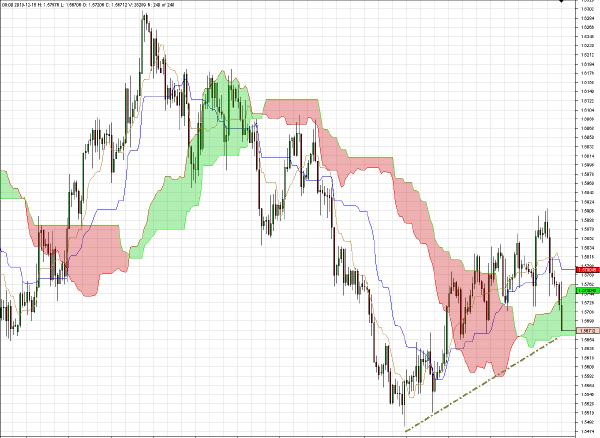
GBP/USD has been selling off abruptly on Wednesday morning in European trading and there is a growing sense that the UK’s Bank of England may find itself snookered over short-term rates and any further QE as the CPI index is rising at a 3.4% annualized rate. The broader measure of inflation, and many would argue more realistic for typical consumers, the RPI rate (Retail Price Index) looks to be headed to 5% in 2011.
It is now becoming a definite policy conundrum for the B of E as to how long it can prop up the property market with ZIRP and the accompanying beneficial flow through to base rate tracker mortgages, while running the risk that, once out of the bottle, it is very hard to get the inflation genie back inside again.
Should sterling fail to find support around the levels seen on the 240-minute chart below, i.e. at the base of the cloud, then $1.5480 becomes a feasible near-term target.
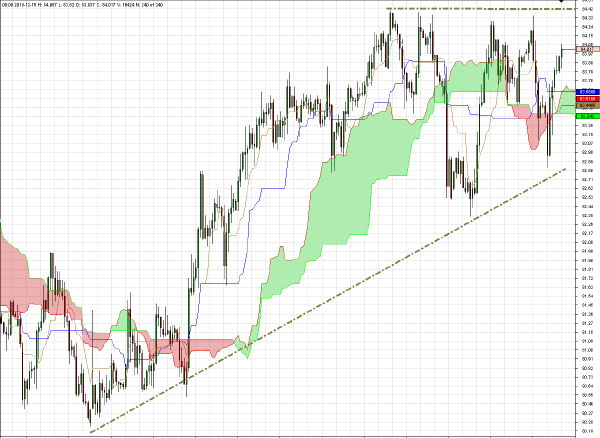
Despite major selling of the dollar during the early part of trading yesterday the 240-minute chart for USD/JPY still reveals that a key uptrend line has not been violated.
Although I would expect trading conditions to become even more volatile over coming sessions, I am sticking with my target of a move towards 85.90 before the end of the year as long as the uptrend line on the chart remains intact.
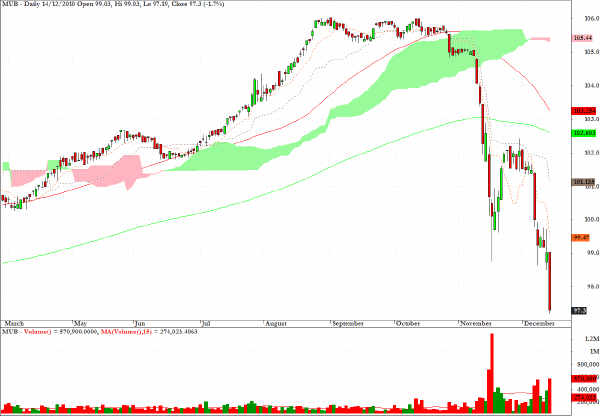
The chart for MUB reveals the dramatic drop in the market’s appetite for municipal debt within the US and the appropriate posture would be one of seeing any rallies as selling opportunities.
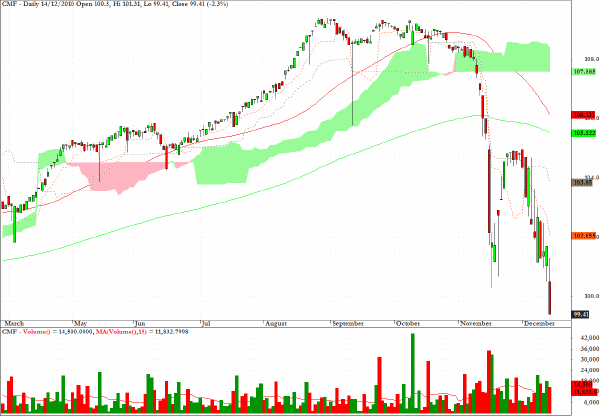
Readers will recall that I have been bearish for a long time on CMF, the exchange traded fund which tracks California’s municipal debt, and as with MUB this chart seems to have the remarkable capacity to keep seeking out lower prices.
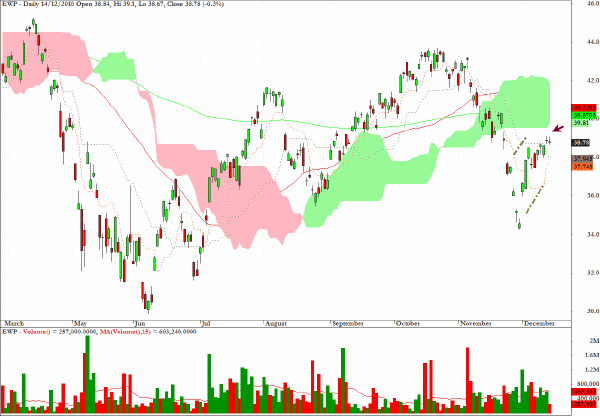
EWP, an exchange traded fund for Spanish equities, looks vulnerable technically and the potential downgrade for Spanish sovereign debt will not be constructive for this market.
Here is my comment from a recent column.
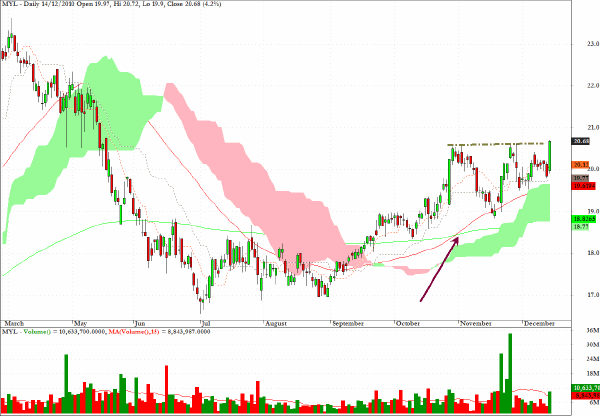
Mylan Laboratories (MYL) has a combination of bull flag characteristics as well as a cup/handle formation and the long side would be appealing from a reward/risk perspective.
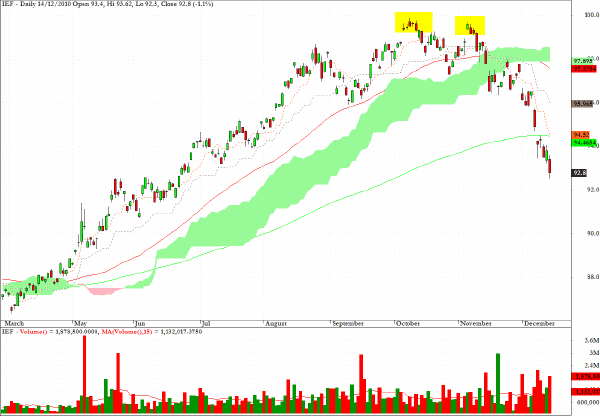
IEF, an exchange traded fund which allows access to prices of UST’s in the 7-10 year maturity range has been tumbling in line with the ongoing uptick in yields on this spectrum of the Treasury complex.
My intuition is that the selling in this part of the yield curve may be reaching a climax and that more sustained damage may now be found at the longer end of the curve, especially the 10/30 year bonds. A long position in IEF and a short position in EDV would be worthy of consideration.
Clive Corcoran is the publisher of TradeWithForm.com, which provides daily analysis and commentary on the US stock market.
|