| The Wagner Daily ETF Report For December 15 |
| By Deron Wagner |
Published
12/15/2010
|
Stocks
|
Unrated
|
|
|
|
The Wagner Daily ETF Report For December 15
For the second consecutive session the major indices showed mixed results, and the Dow struggled with resistance at the November swing high. Stocks saw some strength at the open on Tuesday, but spent the majority of the day muddled in a trading range. Then, at 3:00 pm the market took a turn for the worse and the day ended with only the Dow showing an appreciable gain. The blue chip index finished the session up by 0.4%. The Nasdaq and the S&P 500 both eked out slight gains of 0.1%, while the small-cap Russell 2000 and the S&P MidCap 400 both fell by 0.1% on Tuesday.
Volume was up only slightly in Tuesday's action. Volume on the Nasdaq was up by a modest 2.6%, while the Big Board saw turnover remain almost flat for the session. Volume closed up on the NYSE by an insignificant 0.6%. Day over day, declining volume outpaced advancing volume on both the NYSE and the Nasdaq. Tuesday ended with the ratio at a negative 1.4 to 1 on the NYSE and a negative1.2 to 1 on the Nasdaq. The absence of volume continues to plague the broad market.
Despite the fact that the Dow closed at new 52-week high yesterday, the market remained lethargic. We have stated a number of times in recent weeks that if the laggard Dow were to eclipse its November swing high, this would likely be bullish for the market. However, yesterday's trade brought no reaction to the Dow's rally above resistance of the November 5 high. Further, leadership has been markedly absent over the past several days. At least for the moment, it appears that the massive outflow of cash from the bond market is not finding its way into equities.
An analysis of the Nasdaq, the S&P 500 and the DJIA provides a possible explanation as to the recent action in the stock market. Below are charts of the PowerShares QQQ Trust (QQQQ), the SPDR S&P 500 ETF (SPY), and the SPDR Dow Jones Industrial Average ETF (DIA). All three index funds may be finding technical resistance as a result of the completion of inverse head and shoulders technical patterns. When the neckline is breached on a head and shoulders pattern, the predicted rally (or decline) is determined by measuring the distance from the head to the neckline. Notice the similarities among all three charts. Most noticeable is the absence of volume during the current advance.


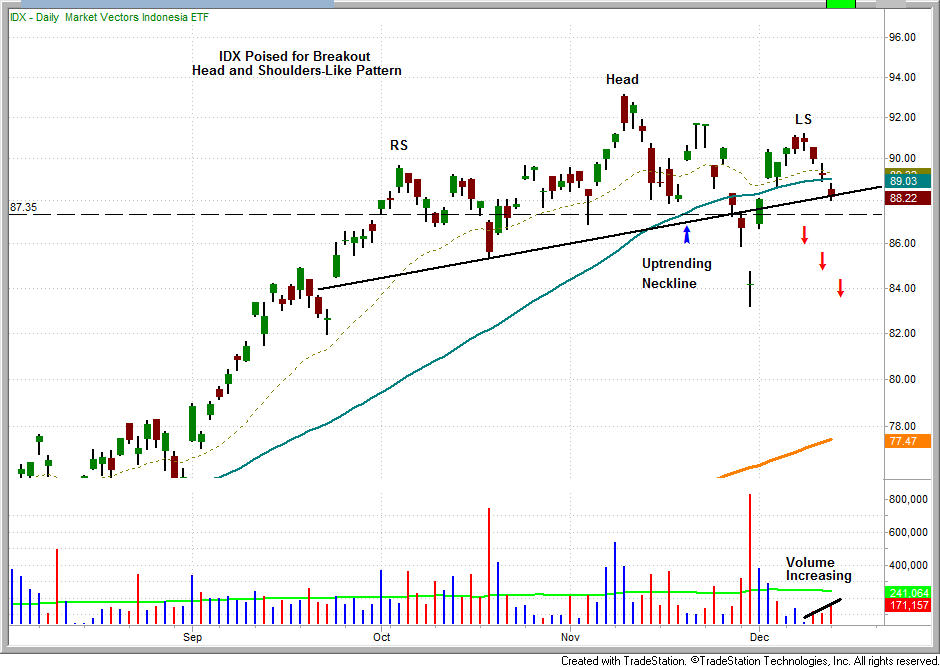
In Tuesday's newsletter we discussed that the Market Vectors Indonesia ETF (IDX), could be on the cusp of losing support. We stated, "given the weakness exhibited by this ETF on November 30, the current price and volume action take on more significance. A move below $87.30 would likely present a shorting opportunity for IDX". Yesterday, IDX gapped down and closed near the lows of the session. This move was accompanied by a massive volume spike. Given the volume fueled bearish distribution of this ETF, the selloff is not likely to subside until the predicted drop of this head and shoulders technical pattern is fulfilled.

Chart of IDX from November 14 newsletter:

Although the Dow has set a new 52-week closing high, the market remains lethargic. This is most likely attributable to the lack of volume (weak market internals) and waning leadership.
Deron Wagner is the Founder and Head Trader of both Morpheus Capital LP, a U.S. hedge fund, and MorpheusTrading.com, a trader education firm.
|