| Corcoran Technical Trading Patterns For December 16 |
| By Clive Corcoran |
Published
12/16/2010
|
Stocks
|
Unrated
|
|
|
|
Corcoran Technical Trading Patterns For December 16
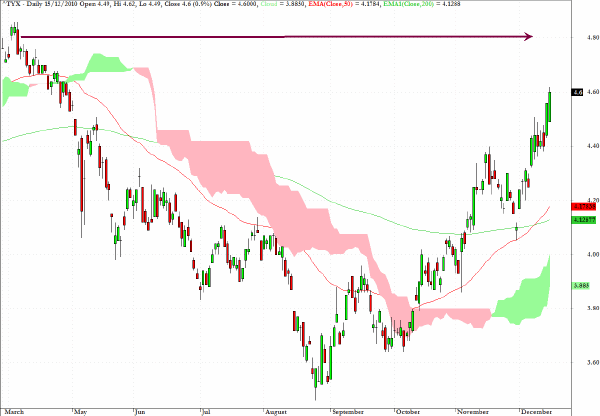
Yields across the UST spectrum are maintaining their upward momentum and the yield on the 30-year bond closed at 4.6% which has also had the effect of pushing mortgage rates in the US back above 5% which may be just one of the unintended consequences of QE2.
As can be seen on the chart the 4.8% level may act as a target/attractor in the near term.
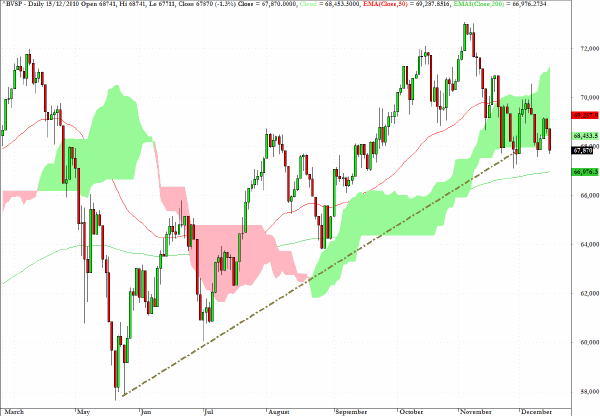
The Brazilian Bovespa index is sitting rather precariously at a key support level.
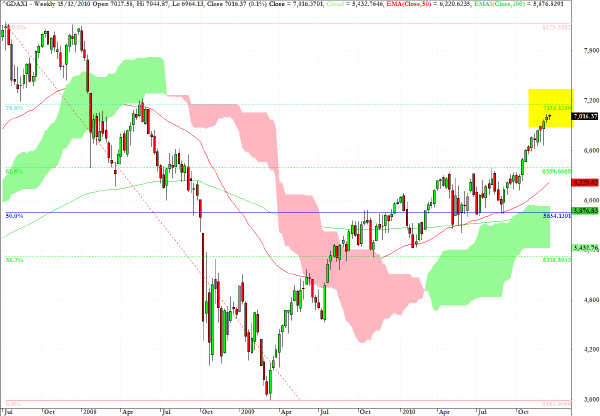
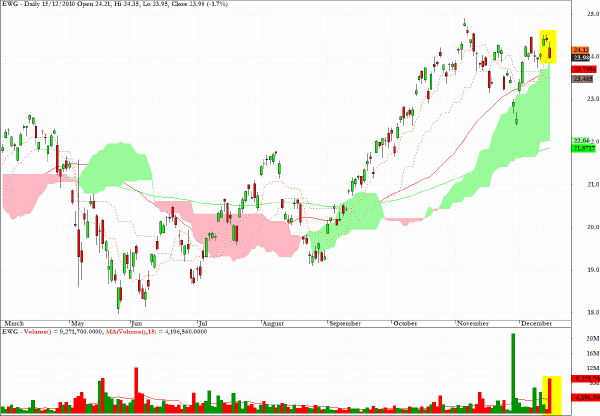
The German DAX has been one of the best performing equity indices in Europe and as can be seen on the longer-term weekly chart, the index has a 78.6% target at 7150. However the ETF which tracks the MSCI Germany Index (see below) does look as though it may be in the early stages of a correction.
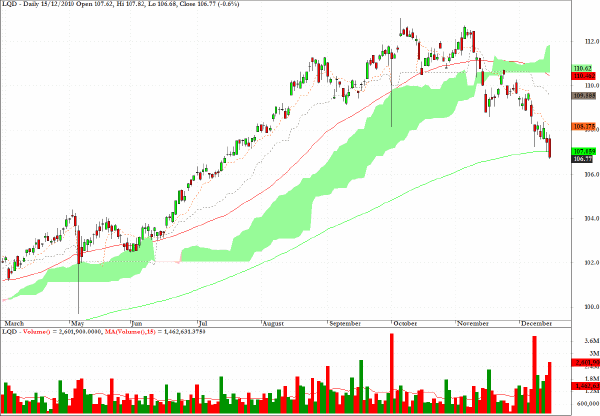
Investment grade corporate bonds, as tracked by LQD, have fallen below the 200-day EMA.
EWG, an exchange traded fund which tracks the MSCI Germany Index, will be worth monitoring for validation that the recent lower top might be the precursor to consolidation/correction.
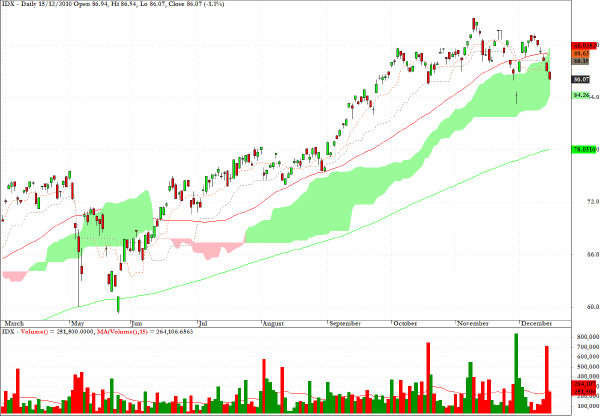
IDX, which tracks Indonesian equities, after registering a series of lower highs may be headed for a test of the base of the cloud formation and even further towards the 200-day EMA which also coincides with a support level on the daily chart.
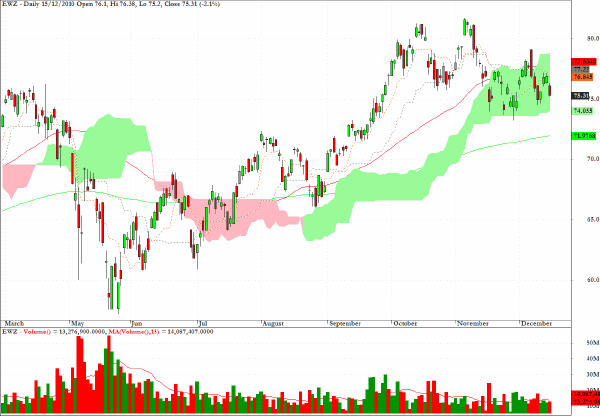
The chart for EWZ, which tracks the MSCI Brazil Index, may also be headed for a testing of the 200-day EMA.
Clive Corcoran is the publisher of TradeWithForm.com, which provides daily analysis and commentary on the US stock market.
|