| Corcoran Technical Trading Patterns For December 17 |
| By Clive Corcoran |
Published
12/17/2010
|
Stocks
|
Unrated
|
|
|
|
Corcoran Technical Trading Patterns For December 17
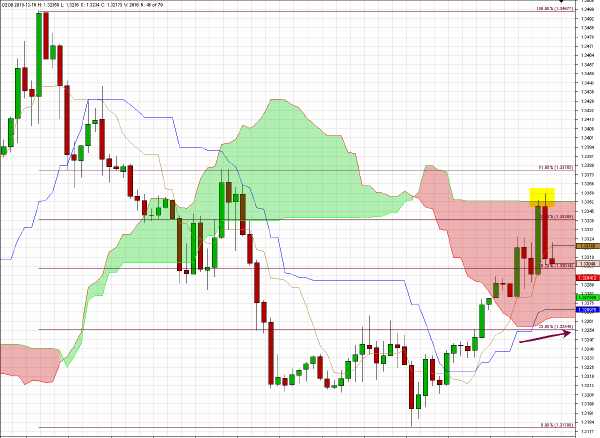
Quite frequently there is a strong fit between the Ichimoku formation and the fibonacci retracement grid, and this is well exemplified on the hourly chart below for EUR/USD.
The euro is currently headed towards a test of the base of the cloud around $1.3255 which also corresponds rather well with the 23.6% retracement of the recent high/low after price was notably rejected literally at the top of the cloud which was just above the 50% retracement level.
As noted here recently, $1.3175 is a key level to watch and a break below that could well see a retest of the $1.30 level.
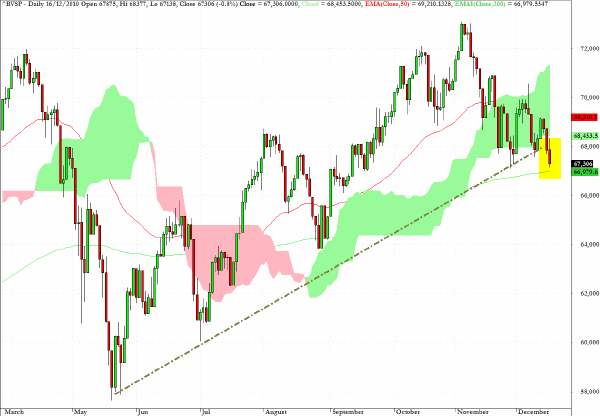
In yesterday’s column I commented that the Brazilian Bovespa index is sitting rather precariously at a key support level. Following yesterday’s close below the uptrend line there is another test at the 200-day EMA (green line on chart) and 64,000 would seem to be a longer term target if further corrective behavior unfolds.
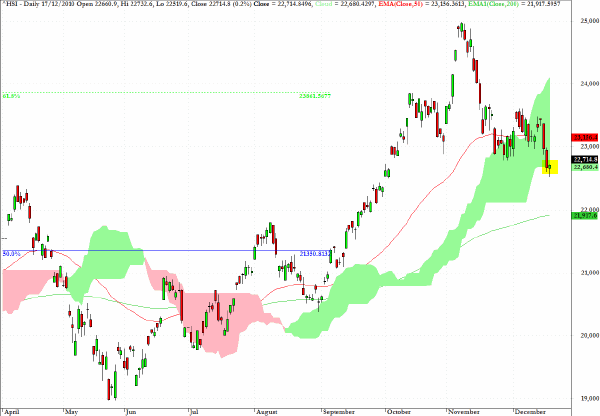
A couple of weeks ago I was targeting the base of the cloud formation for the Hang Seng Index which actually occurred in Thursday’s session. It will be quite important in assessing overall risk appetite to see whether the pause at the base of the cloud could be the beginning of a recovery phase or whether the index will continue lower with 22,000 being the next obvious downside target which coincides with the 200-day EMA.
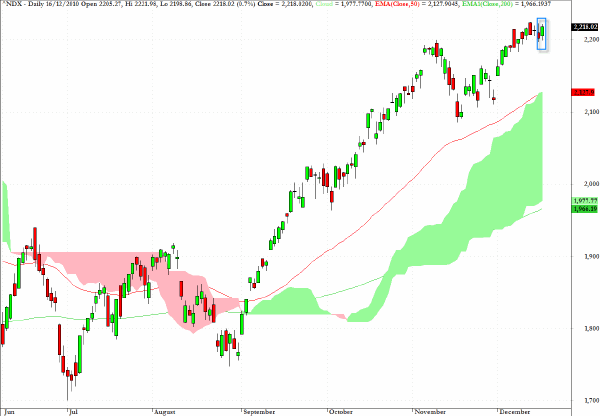
The Nasdaq 100 registered an inside pattern following yesterday’s action and I would repeat my comment from earlier this week that there is a possible double top pattern evolving as the current level is almost exactly the multi-year high achieved in November 2007.
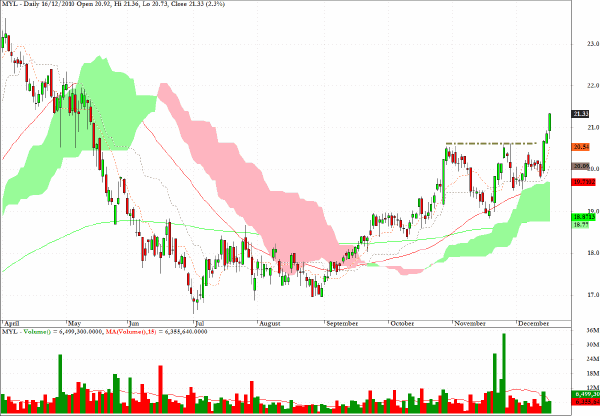
Mylan Laboratories (MYL) has continued to exhibit the bullish price development which was anticipated here twice in the last few weeks.
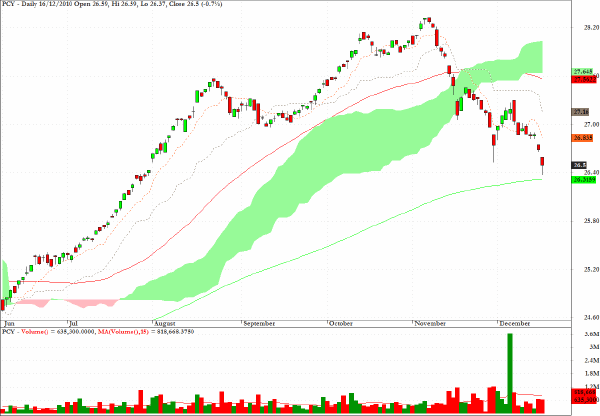
Although I exited PCY, the fund which tracks returns available on emerging market sovereign debts, some time ago with considerable profit, I should have been more patient and waited until the 200-day EMA was reached --- which now looks feasible in coming sessions.
Here is a comment from Daily Form on December 10.
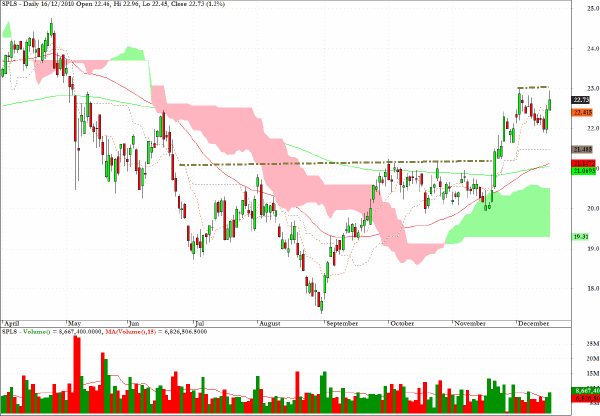
Staples (SPLS) reveals the early stages of a cup/handle pattern at a key level and also, as the 50-day EMA is seen crossing the 200-day EMA from below following yesterday’s session, I would be inclined to look for long entry points during the next couple of sessions.
Clive Corcoran is the publisher of TradeWithForm.com, which provides daily analysis and commentary on the US stock market.
|