| Corcoran Technical Trading Patterns For December 20 |
| By Clive Corcoran |
Published
12/20/2010
|
Stocks
|
Unrated
|
|
|
|
Corcoran Technical Trading Patterns For December 20
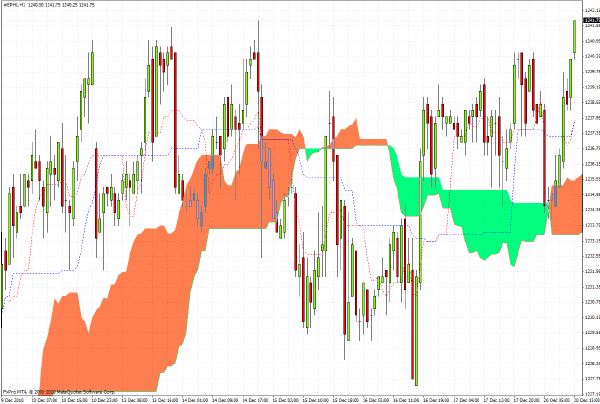
The S&P 500 futures (e Mini March contract) look poised to break above resistance at 1242 on the hourly chart indicated below.
The DAX is currently registering a new multi-year above 7050 and the CAC 40 has made a remarkable recent reversal from its plunge below 3600 in late November and is currently trading above 3900. Thin markets seem to be favoring the bulls and with plenty of accommodative policy from central banks in the "mature" economies, and with many taking the view that one can apply a linear weighting system of pluses and minuses to the various major factors, such as better economic statistics in the US on the one hand versus more serious problems in the EZ than anticipated (not to be revealed in gory detail again until euro bond markets "re-open" for business in January), there is "on-balance" a positive outlook for equities which should keep markets rising for some time yet.
As alluded to, the real problem is that one cannot really run such a simplistic balance sheet analysis using "linear" weightings, and only when the non-linear dynamics of debt contagion resurface - which I expect them to do during Q1, 2011 - will the fallacy of this kind of back of the envelope weighing of the fundamentals become apparent.
But in this season of good cheer and happy times let’s not dwell too much on such awkward matters.
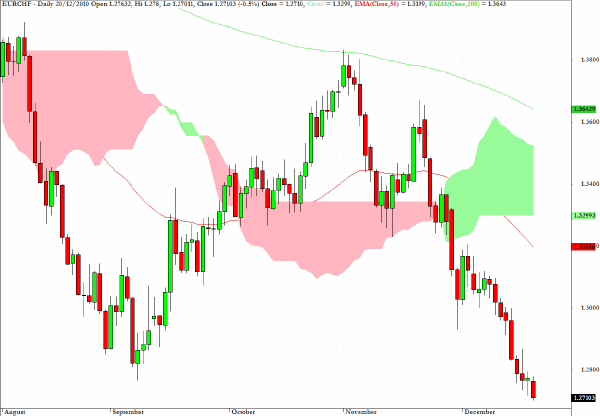
As anticipated here last week, EUR/CHF is taking another leg down and the daily chart below - which includes pricing on Monday at noon European time shows the euro at a historic low against the Swiss Franc.
Lots of wealth seems to be escaping the euro and shifting into the safe havens of Swiss banks and the Swiss currency.
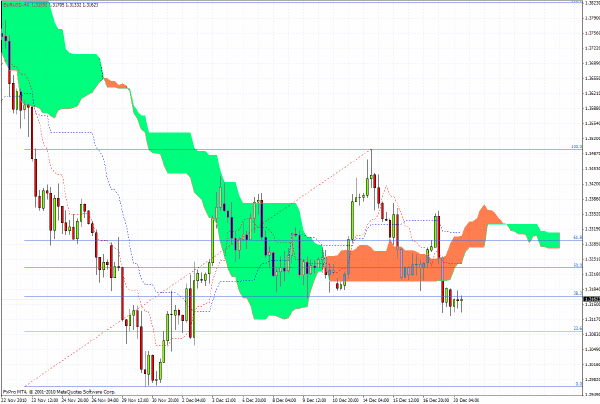
The hourly chart for EUR/USD with a superimposed fibonacci grid highlights the significance of the $1.3175 level as it sits at the 38% retracement level of the high/low seen on the chart.
If we can regain ground above this level, then just for today’s session I would be looking for a retest of the $1.3280 level. If, on the other hand, the recent intraday low of $1.3120 is taken out then one suspects that the next target for the bears will be $1.30.
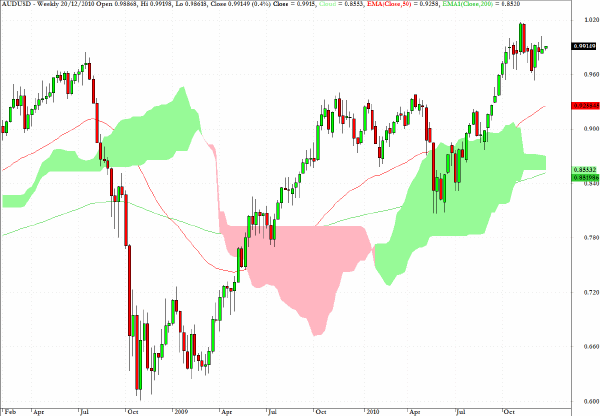
Sometimes when taking a big picture perspective with FX trading, it is advisable to look at the longer-term weekly charts. With this in mind with respect to AUD/USD, the risk reward calculus would keep me cautious of playing the long side of the Aussie dollar, on anything but an opportunistic and intraday time horizon, in coming sessions.
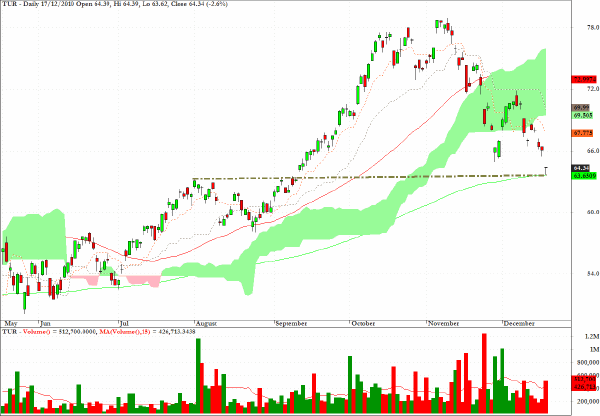
TUR, which tracks Turkish equities, has reached a level where a bounce should be expected.
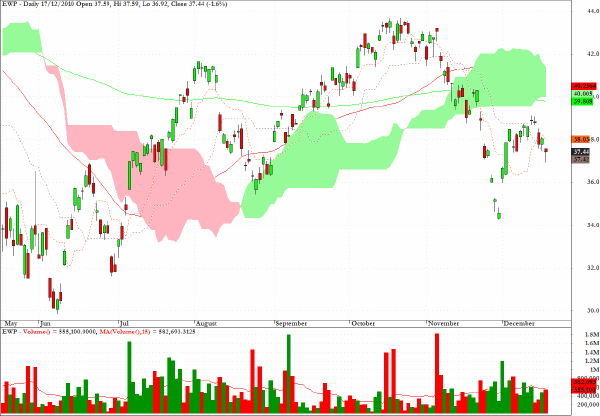
EWP, an exchange traded fund for Spanish equities, remains relatively unattractive with respect to other opportunities in equities in different geographical regions.
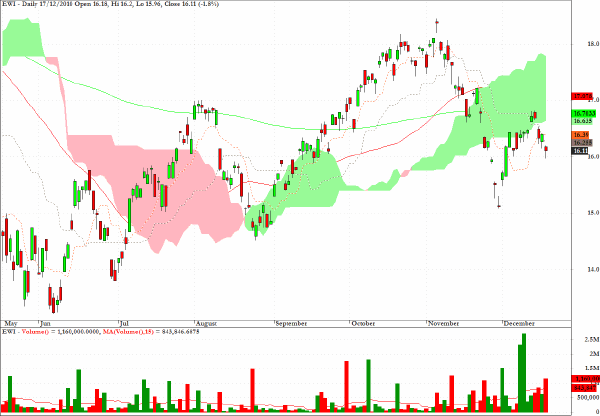
Somewhat in accordance with the issue of sovereign risks for Spain, which I would expect to become urgent again in early 2011, one can also add the growing political risks in Italy and this is why EWI, an exchange traded fund which tracks the MSCI Italy Index, also looks unattractive longer term.
Clive Corcoran is the publisher of TradeWithForm.com, which provides daily analysis and commentary on the US stock market.
|