|
Corcoran Technical Trading Patterns For January 5
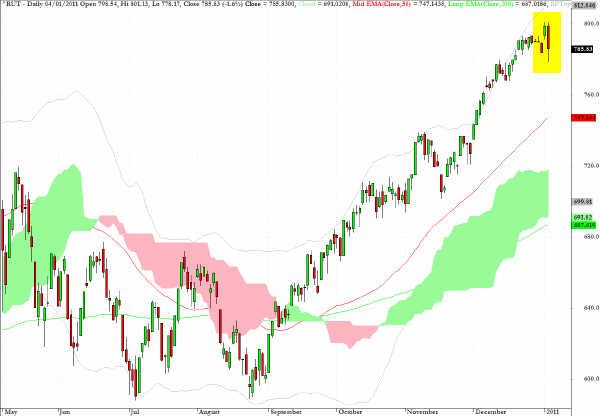
During commentaries last December I suggested that the 800 level would act as a target/attractor for the Russell 2000 and I suspected that the level might be seen before the 2010 year end.
It turns out that we had to wait until the turn of the year to witness the touching of the target level and the reversal and 1.6% decline yesterday would seem to suggest that the micro caps may be in need of a pause to refresh.
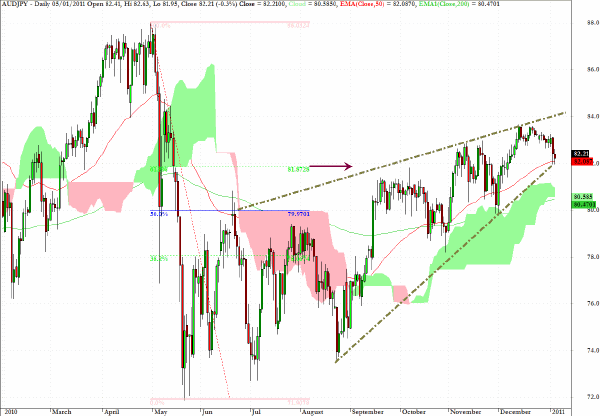
Today’s focus instrument will be the AUD/JPY exchange rate which provides a useful inter-market indicator of risk appetite.
The daily chart below shows several significant technical characteristics:
1. There is support close to current levels provided by the 50 day EMA and the 62% retracement level indicated by extending the arrow across
2. Below that there is cloud support in the critical zone around the 80 level - which I would expect to be tested.
3. The rising wedge pattern annotated on the chart shows that a drop into the cloud would be quite critical for this cross rate and an intraday move below 80.50 (which is also the 200 day EMA) would persuade me that the rate would need to throughly test the 80 level.
4. Should the rate close decisively below 80 in coming sessions this would amplify the exodus from EM and commodity based assets.
As we move into 2011 I'll provide examples, on a fairly regular basis, of studies related to the co-movement of certain assets to illustrate my increasing preoccupation with intermarket and Big Picture themes which I believe will constitute the underpinnings for major inflection points in markets in 2011.
The EZ crisis will undoubtedly move to the fore again in the next few weeks and while there seems to be a promising case for global equities the larger issues relating to the future of QE and whether the financial system is robust enough to handle a move away from ZIRP as its continuation raises justifiable concerns about currency debasement and accompanying inflation.
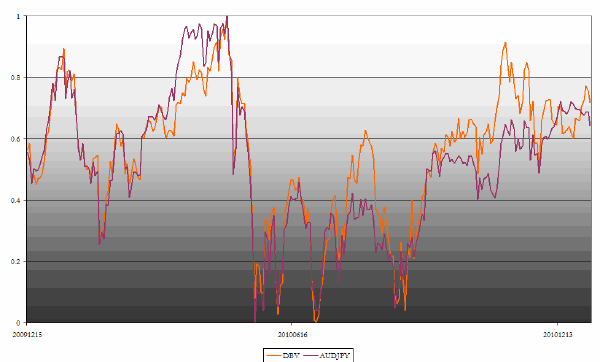
As an example of co-movement, the chart below shows the highly correlated behavior of DBV, which is an ETF which focuses on high yield and low yield currencies (and in some ways provides access to the carry trade) and the AUD/JPY exchange rate. The two assets have been normalized and their trajectories map each other quite extraordinarily well.
On a trailing 35 day basis the correlation coefficient at present is above 0.8 and historically the beta between the two instruments has a tendency towards unity. Both of these attributes suggest that DBV is a very good proxy for AUD/JPY and allow traders who wish to engage in inter-market strategies involving currency plays with other ETF’s the opportunity to use DBV as a surrogate for the currency pair. In addition the usefulness of DBV as a reflection of risk appetite also makes possible market timing strategies which can be predicated on using an analysis of co-movements between DBV and other risk on ETF’s
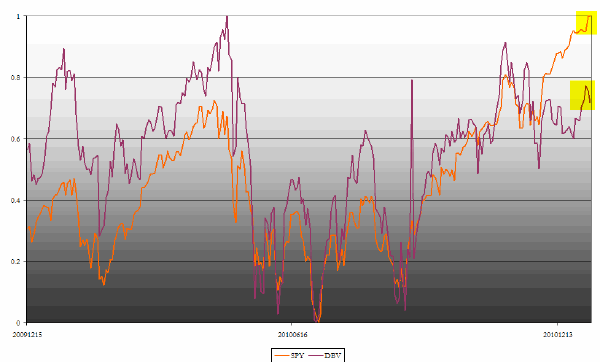
The following chart reveals the normalized co-movement of DBV and SPY. Evident on the chart is the high correlation which is certainly one of the highest between a currency-based instrument and a key equity index.
There is the suggestion that there may be a divergence on the right hand side of the chart as SPY is registering its highest normalized values - reflected in its proximity to the value of one - while the DBV normalized value is beginning to retreat. This is the kind of evidence which needs to be monitored in coming sessions as there are other technical suggestions that equities may be close to (if not already at) a near-term top.
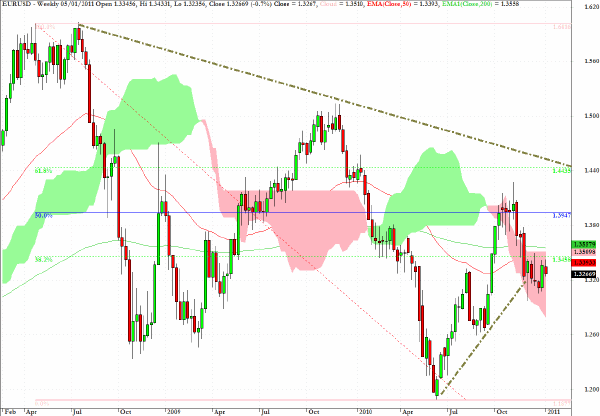
EUR/USD notably failed to reach back to the $1.44 level on the weekly chart below, and has now dropped below the 38% level on the fibonacci grid superimposed on the price action.
While the exchange rate remains within the pink cloud one should expect trendless trading and I'll step aside from position trading this rate until the exit from the cloud provides more clues as to the longer-term direction.
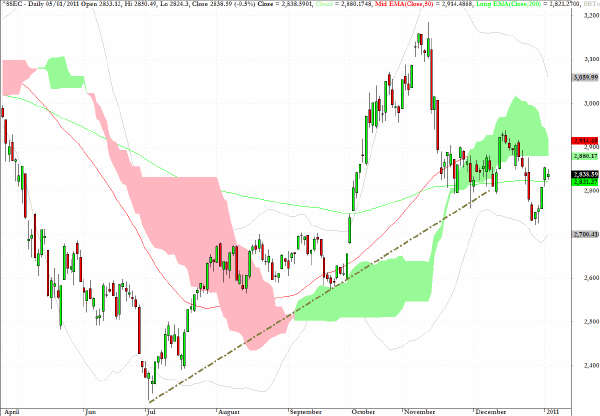
Having broken below the dotted support line during December, the Shanghai Composite Index is attempting to re-enter the cloud formation from below and is also sitting right on top of the 200-day EMA.
Of some concern is the fact that having registered a bullish crossover with the 50-day EMA moving above the 200-day EMA in November, the red line (hidden behind the cloud) has now turned down again and has the potential to register a bearish crossover.
Should this arise the brevity of the period following the positive crossover would be technically troublesome.
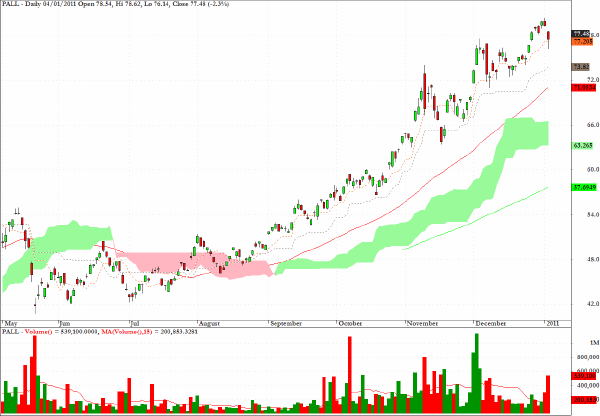
An intermediate target for PALL, an ETF which tracks the price of palladium, would be at $71 which coincides with the 50 day EMA (red line) as well as an area of chart support/resistance.
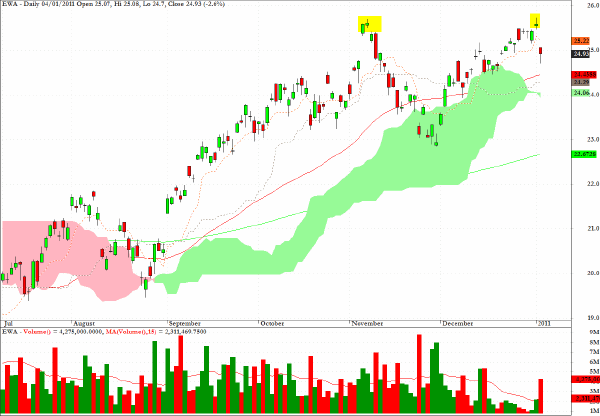
EWA, an exchange traded fund which tracks the MSCI Australian index, has a formation which might reveal itself in coming sessions as an intermediate term double top. It is also worth pointing out that EWA is very highly correlated with AUD/JPY (and in turn with DBV).
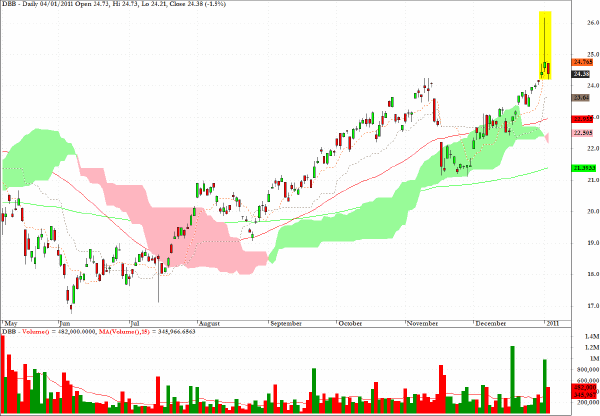
The exchange traded fund DBB which is a useful proxy for spot prices in the industrial and base metals sector printed a rather striking gravestone doji candlestick in Monday’s trading.
Clive Corcoran is the publisher of TradeWithForm.com, which provides daily analysis and commentary on the US stock market.
|