| Corcoran Technical Trading Patterns For January 7 |
| By Clive Corcoran |
Published
01/7/2011
|
Stocks
|
Unrated
|
|
|
|
Corcoran Technical Trading Patterns For January 7
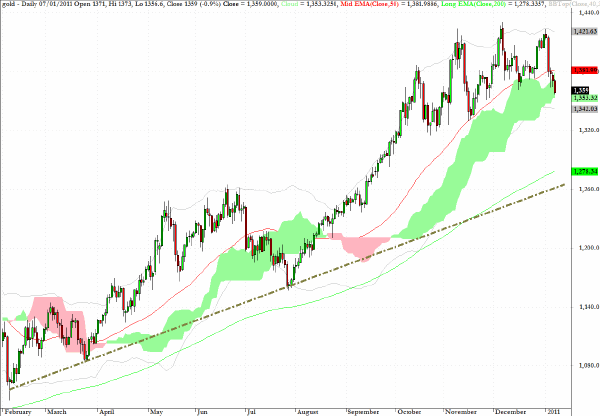
The runup in spot gold at the end of last year and the failure to reach the previous high of $1431 achieved on December 7 provided a warning that a corrective period was likely as we entered 2011. The performance of precious metals during 2010 was one of the standout investment themes and I remain firm in my view that gold and silver are still in fundamentally bullish phases.
A correction back to the $1270 area on gold - as illustrated by the dotted trend line through the lows - would not be unsurprising, although as fears about incipient inflation in emerging markets, especially India and south east Asia, are mounting, the metal may continue to show resilience after a shakeout of the late to the party momentum players has run its course.
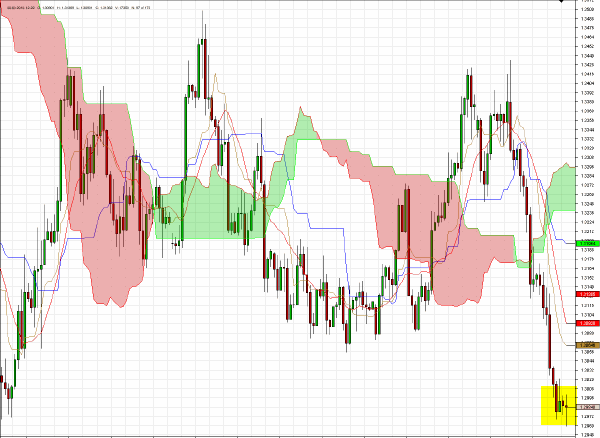
The analysis provided yesterday of the critical importance of the $1.3075 area on EUR/USD turned out to be timely and once the level was broken trading the short side produced some relatively easy profits all the way down to the $1.30 level where a predictable bounce occurred.
In overnight trading the euro went exactly to test the $1.2970 level as anticipated here yesterday and currently is still in this vicinity. I have gone flat for the next few hours and will re-examine trading options based on price behavior after the NFP data is released.
Breaking below the $1.29 level would be a trap door to lower prices and the news flow regarding the EU’s proposed haircuts for senior bondholders - which means basically the large European banks - will continue to unsettle the sovereign bond markets within Europe. CDS spreads are blowing out for all of the usual suspects including Belgium which has effectively been without a government for several months. Spain and Portugal continue to deteriorate and the Irish CDS rates are suggesting that increasingly traders are discounting more than a haircut and more likely some form of re-structuring or default.
As discussed here previously, the key territory to watch in coming weeks is Spain and if the situation there accelerates to the downside things will become ugly for the EZ.
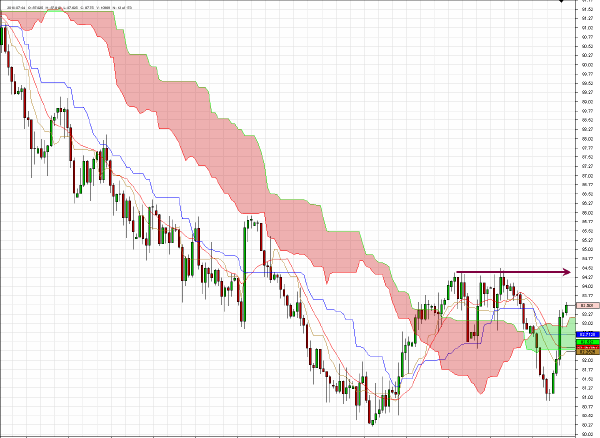
Here is a followup from yesterday’s comments regarding USD/JPY which I shall reiterate:
One rather striking development following the ADP report yesterday was the sell off in the yen and as can be seen from the daily chart the USD has risen above the Ichimoku cloud again after its previous setback.
Longer term I am still targeting a test of the 86 area as the dollar’s attraction vis a vis the Japanese currency seems to be slowly gathering converts on both a fundamental and technical basis.
There is a possibility that a strong NFP report today has the potential to see USD/JPY move back to test previous resistance at the level indicated by the arrow on the chart.
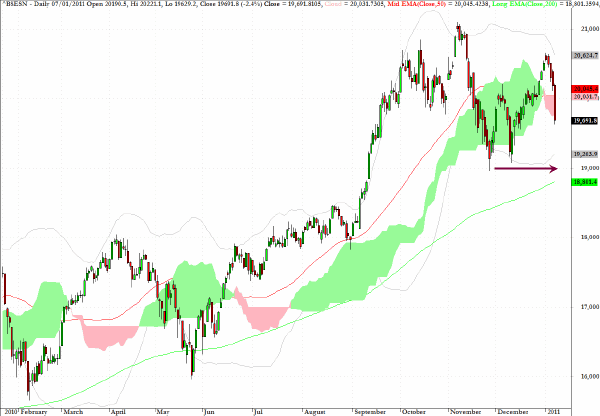
The Mumbai Sensex Index took a nasty tumble in Asian trading on Friday with a 2.4% drop as technical conditions are unfavorable and the fundamentals are being undermined by the inflationary pressures which are manifesting themselves in much of the EM world due to the massive amounts of liquidity being generated by the Fed and other central bankers in the mature economies .
The arrow indicates a possible target in the vicinity of 19,000 for the index to sink to before a firm foundation is in place for another leg up to ensue. However a failure at this level would not be encouraging for the many portfolio managers who have committed heavily to the BRIC markets and could be the precursor to some rather nasty fund liquidations across many EM related sectors.
The following comment appeared in the December 16 newsletter.
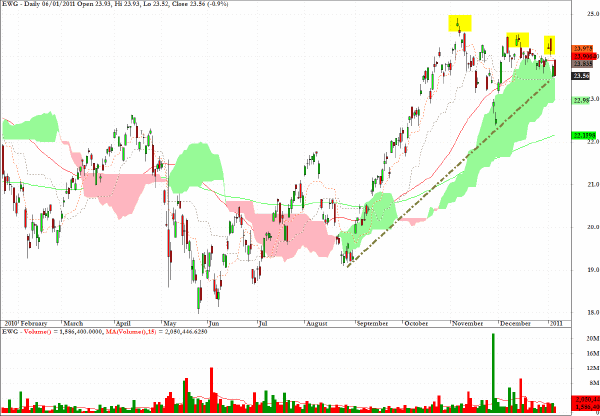
EWG, an exchange traded fund which tracks the MSCI Germany Index, will be worth monitoring for validation that the recent lower top might be the precursor to consolidation/correction.
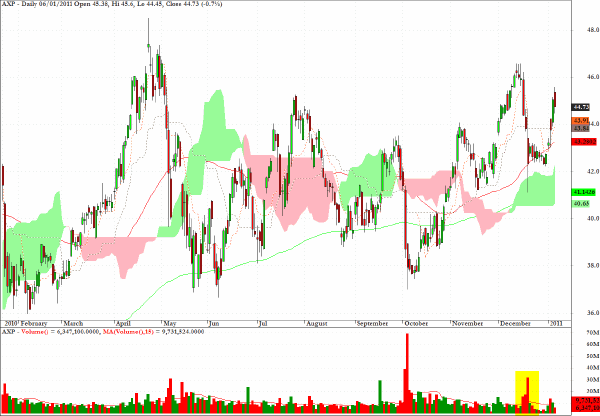
American Express (AXP) has a weak technical pattern and I would be looking at entry opportunities on the short side near to current levels.
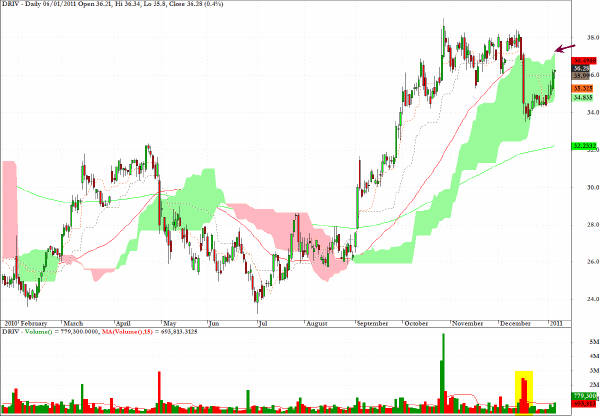
The chart pattern for Digital River (DRIV), showing a pullback almost to the top of the cloud formation following the relatively high volume selling illustrated, suggests that this stock may be vulnerable to renewed selling near to the levels indicated by the arrow on the chart.
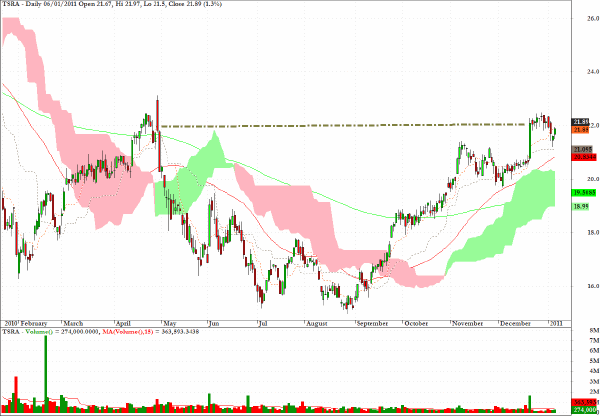
Tessera Technologies (TSRA) has a constructive looking chart pattern and if the stock can break above the red reversal candlestick from late April of 2010, with an intraday high just above $23, then we could see a move up towards $27 in the intermediate term.
Clive Corcoran is the publisher of TradeWithForm.com, which provides daily analysis and commentary on the US stock market.
|