NASDAQ Commentary
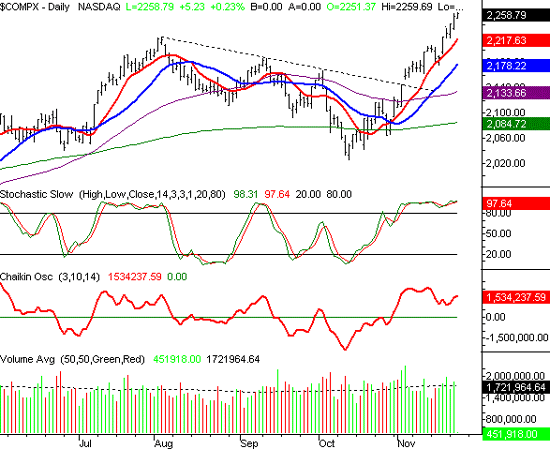
The NASDAQ's rocket ride is continuing this week, as the composite again is hitting new highs, and investors don't even care (or realize?) just how far they've come in the last five weeks. In mid-October the index was headed towards 2000. Today, it's at 2258 - and itching to go even higher. After seeing this kind of move, the least we can say is that we're out of the woods.
By "out of the woods", we just mean that the market's sideways, choppy motion isn't going to turn into a bear trend while nobody realized it. When the market goes nowhere, traders can get bored, lose interest, and then let stocks make a slow, methodical slide - due to a lack of interest. That was an issue we were facing for most of 2005, especially after a rough start. But over the last few weeks, the crossing of some major milestones has renewed a little interest in stocks again; it's a welcome change. The biggest milestone, of course, is the ascension into new 52-week highs. Since completing that feat on the 17th, the NASDAQ really hasn't looked back.
OK, we know that still doesn't specifically define 'out of the woods'. Here we go.....even from here, a major pullback would still (probably) be halted somewhere around 2200. That's right in the middle of the 10 day average (red) and the 20 day line (blue). We've seen both of them act as support this year, and although a dip all the way to the 20 day average at 2178 would be healthier, a lot of folks are buying on the dip back to the 10 day line, like we saw on the 16th. At that point - the 16th - the NASDAQ had been on a major run, so some selling was inevitable. We got it, but quite frankly, it wasn't enough to allow for a sufficient base to be established. The very next day, stocks rallied again, having never corrected the overbought (see stochastics) situation.
That leaves us caught somewhere between reason, and momentum. From a rationale perspective, the mini-bubble has to be popped soon, and trader giddiness has to be tempered. From an 'it is what it is' point of view, the momentum is clearly bullish. Obviously both perspectives can't be right....at least not at the same time.
Despite the momentum, we're going to err on the side of caution and assume we're due for some sort of small pullback next week. We'll look for support at the 10 day line first (at 2218). If that breaks, then look to the 20 day line to keep the NASDAQ afloat. No big deal - just a normal corrective action that would still leave the index in a lot better shape than it had been for most of 2005 (hence, 'out of the woods'). So after that, the bulls should be back at it through the end of the calendar year.
NASDAQ Chart

S&P 500 Commentary
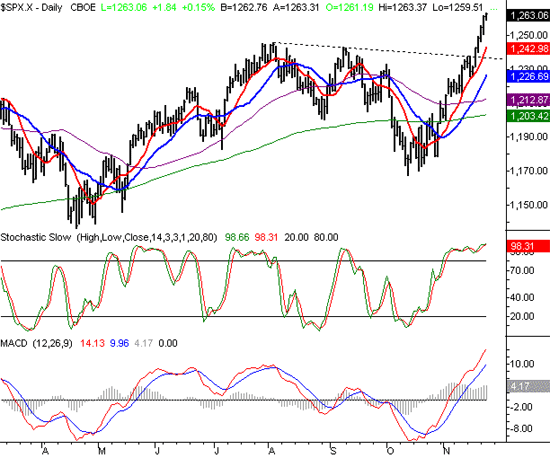
Like the NASDAQ, the S&P 500 blew past resistance and is now trading at new 52-week highs as well. That resistance line (dashed) was at 1238 in the middle of last week when it was breached, and the five sessions since then have been pretty typical of a breakout move - red hot. But, the higher they fly, the harder they fall, which is why we're hesitant about jumping on the bullish bandwagon at these current levels.
Although we're seeing major gains now, we'll just remind you that this week (of Thanksgiving) is almost always bullish, regardless of the bigger trend. Given that this strength may be a little artificial, we don't want to read too much into it. Admittedly, this is also the most bullish period of the year, and it's tempting to jump in when it seems like you're missing out. But, discipline is the key - wait for a better entry point. Like the NASDAQ, we think the smarter entry point would be closer to the 10 day average at 1243.
In the case of the SPX, though, there's something even more bullish in the bigger picture - the worst case scenario. Even if the index falls all the way back to the 20 day average, it may still find a floor above this year's previous high of 1245 (from August). The 20 day line is not there yet, but it's rising sharply from its current level of 1227, so it may be there by the time any pullback occurs. Clearly the potential support that the 10 day line could provide at 1243 would be above the prior high. The point is, the pattern has changed from a range-bound market to a market this is making higher highs and higher low......also called a bull market.
S&P 500 Chart

Dow Jones Industrials Commentary
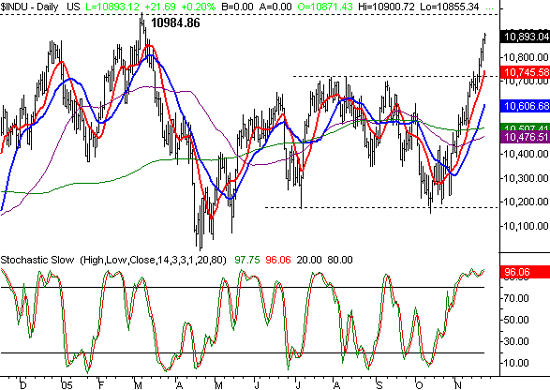
Nothing new here - the Dow is well above its previous resistance point of 10,720, and looks to be making a run on a new 52-week high as well.....the 10984.86 mark. But as with the other indexes, we don't think the blue-chip index can do it in one straight shot. There's just too much pressure kicking in from all the recent gains. We're looking for a dip back to at least the 10 day average (10745), or to the 20 day line (10606) at the most. After that, this chart should keep on trucking as well.
Dow Jones Industrials Chart

Price Headley is the founder and chief analyst of BigTrends.com.