| Corcoran Technical Trading Patterns For January 10 |
| By Clive Corcoran |
Published
01/10/2011
|
Stocks
|
Unrated
|
|
|
|
Corcoran Technical Trading Patterns For January 10
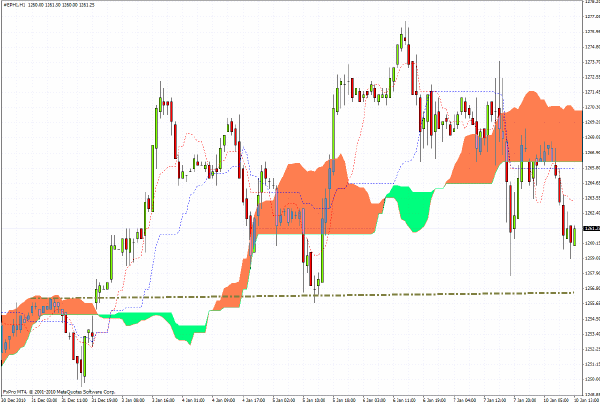
The hourly chart for the March contract for the S&P 500 futures shown below highlights the importance of the 1255 level which marks a support line (even a possible neckline) for the recent sessions which are beginning to take on a corrective tone.
The NFP data was interpreted as disappointing by most risk-on protagonists, and the drop in Treasury yields suggests that the flight from safe haven assets is far from a one way bet for the time being.
In a perverse way equity bulls should welcome the lack of vitality in the US main street economy even though the growing divergence between those with significant net worth and those with nothing (43 million Americans are on food stamps) will become increasingly problematic from a broader socio-economic and cultural perspective.
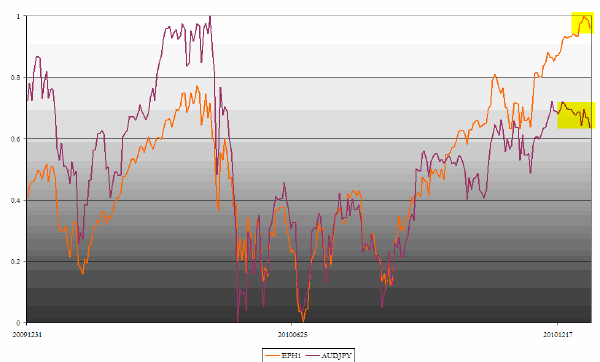
The correlation studies initiated last week with a chart which showed the normalized trajectories of the S&P 500 and AUD/JPY has been updated to be current as of Monday morning.
The eMini futures has been used as well as the prevailing spot rate for AUD/JPY and as was intimated last week the decline in the exchange rate, it could be argued, helped to strengthen the case that the enhanced appetite for risk assets at the end of 2010 had become overdone and that a correction was to be expected as we entered 2011.
The key level on AUD/JPY to monitor this week will be the 80 level and as long as that can be maintained the correction in many global equity markets, especially the EM’s, should not turn into a rout.
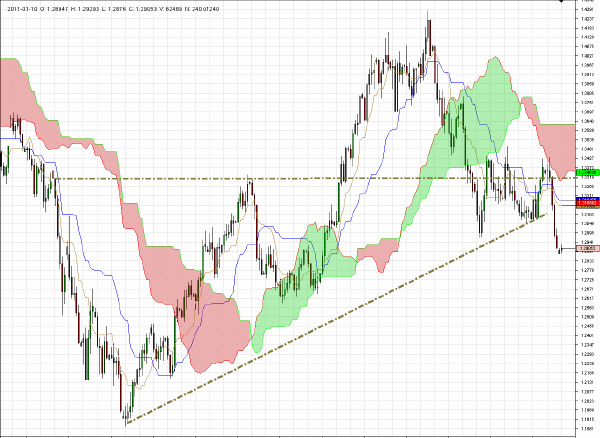
The most obvious technical characteristic observable on the daily chart for EUR/USD is the violation of the uptrend line which took place last week as sovereign debt market players showed their dislike of proposed haircuts and the fragile financial condition of Spain, Portugal and Belgium weighed on sentiment for the future of the EZ as a monetary union.
Also apparent is the strong overhead resistance indicated by the dotted horizontal line around $1.33.
During European trading on Monday the euro has slipped just below $1.29 and while targets down to $1.2670 are now feasible in coming sessions, it could be that there will be an attempt to rally back towards the $1.30 level before the bears seize control again.
Also worth consideration is the fact that the PBOC and Chinese government have a lot at stake with heavy exposure to euro-denominated assets and they are also anxious about not having to rely solely on their USD denominated holdings as the only store of value for their retained earnings.
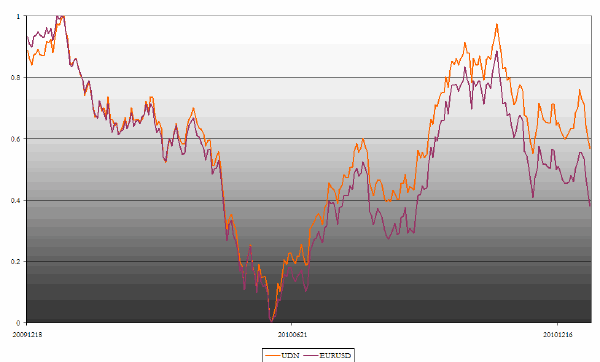
The chart below indicates the normalized co-movement of UDN - the exchange traded fund which is effectively short the dollar against a basket of currencies and generates positive returns when the dollar weakens - and the EUR/USD cross - where strength in the euro obviously translates into dollar weakness as well.
What is most remarkable about the chart is that for most of the period the two are highly correlated but the most recent trajectories show that EUR/USD is showing relative weakness with respect to the other constituents of the basket of currencies. Given the increasing vulnerability of the EZ framework - and vehement denials by the Portuguese government that they will be seeking a bailout package makes that eventuality a virtual certainty - there are some viable low risk spread trading possibilities involving the pair of exchange traded funds, FXE and UDN.
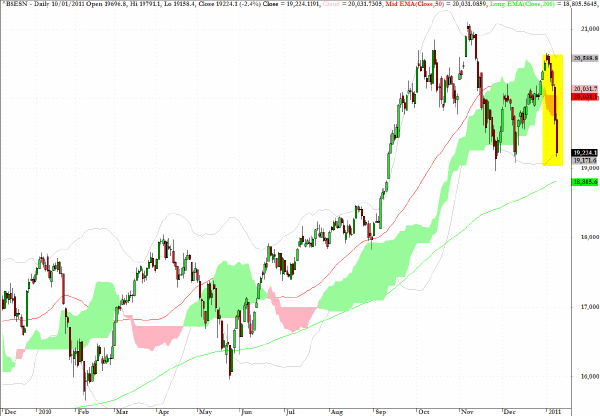
The highlighted section on the chart below for the Mumbai Sensex - the official index for the Indian market - reveals just how severe has been the correction in one of the favorite markets for portfolio managers over the past two years.
I'll repeat my comment from Friday that the zone around the 19000 level including the 200-day EMA at 18,800 is pivotal for this market.
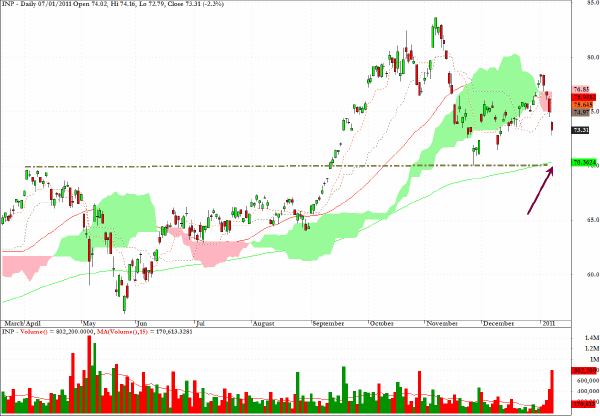
Developing further the theme from above, INP which tracks the MSCI India index, should find buying support at the level indicated by the arrow on the chart. Just how enduring that support is remains to be seen.
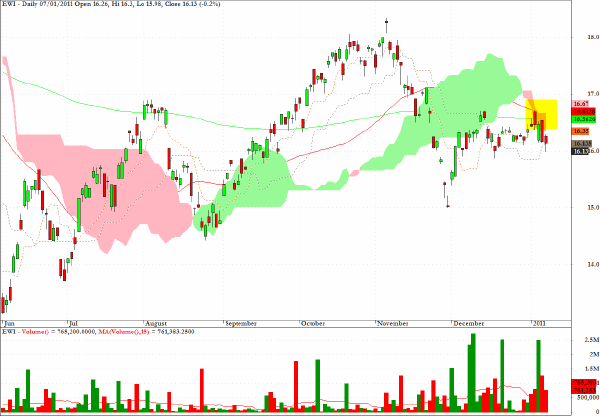
EWI, an exchange traded fund which tracks the MSCI Italy Index, from a relative performance perspective, looks unattractive longer term. The highlighted area reveals that the 50-day EMA appears ready to move below the 200-day EMA and as such EWI joins other European equity indices - including EWP (Spain) and EWK (Belgium) which should be avoided.
Clive Corcoran is the publisher of TradeWithForm.com, which provides daily analysis and commentary on the US stock market.
|