| Corcoran Technical Trading Patterns For January 14 |
| By Clive Corcoran |
Published
01/14/2011
|
Stocks
|
Unrated
|
|
|
|
Corcoran Technical Trading Patterns For January 14
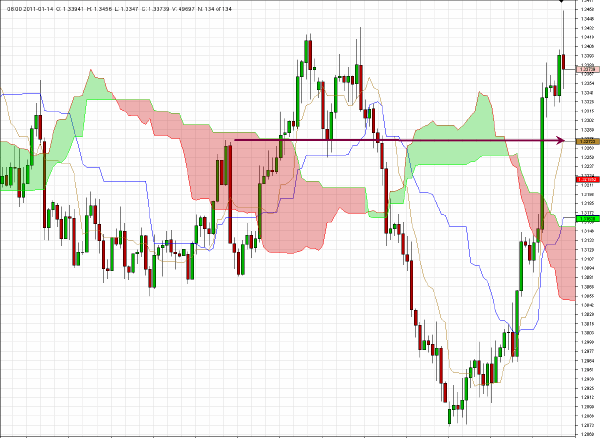
EUR/USD was the main market focal point in yesterday’s trading as a combination of the PBOC’s policy of "currency management" and a stellar performance by Monsieur Trichet in not only quietly orchestrating major support for auctions of Spanish and Italian government issue, but also sounding impenetrably abstruse but still hinting that maybe the ECB could be thinking about rate hikes.
Yesterday I suggested that $1.3340 was major resistance and the euro did stop there briefly to catch its breath but then surged up almost another 100 pips as a massive short squeeze caused a fantastic trading day for those long the single currency - against all of the major crosses. Incidentally I did post to my Twitter account an amended target of $1.3450 yesterday afternoon which is more or less where the parabolic move finally came to rest.
In Friday’s trading - which itself is proving quite eventful following tightening moves by the PBOC - the euro appears to have topped out and may head back down towards $1.3275 before another upward move should be expected.
The sovereign debt dynamics troubling the EZ have not changed at all as a result of the helping hand from the Chinese authorities, and it still remains incumbent on the EU technocrats to cobble together a feasible solution to a monetary union which lacks fiscal unity and discipline from all of its member states. As suggested before I am doubtful that this can be done.
For any readers who are based in the UK, or visiting London next week, I'll be making a presentation to the CFA Institute at Canary Wharf next Tuesday evening. The subject matter will be my increasing focus on intermarket quantitative analytical tools, including the correlation studies which have been featured here recently.
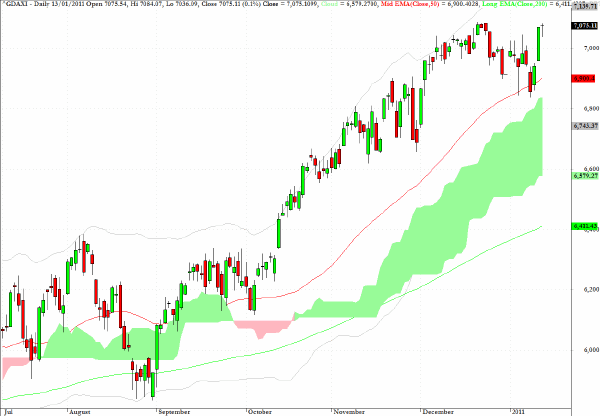
Germany’s DAX registered a tiny hanging man formation yesterday and is under some pressure in European trading this morning. The exchange traded fund EWG is one way to take a position on German equities and I leave it to the discretion of the reader as to when to pull the trigger - but there is a lot of good news already baked into this market.
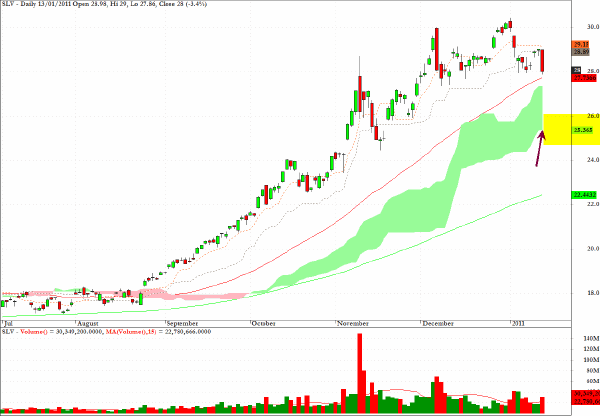
My warning on SLV in Wednesday’s column proved timely as the metal dropped 3.4% in yesterday’s trading. Even though there may be a bounce off the 50-day EMA I will stick with an intermediate-term target, as indicated on the chart, of an eventual to the bottom of the cloud formation - in the vicinity of $25.
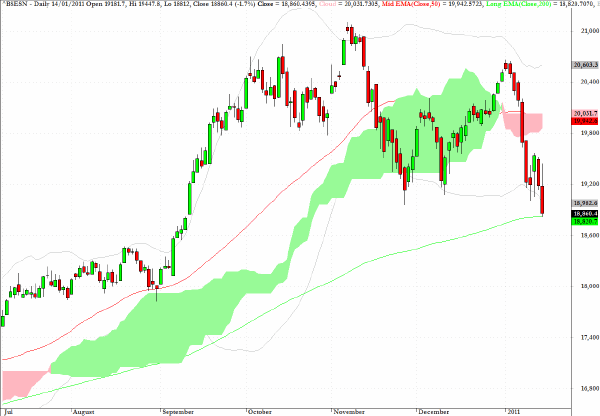
In two recent columns I have suggested that the Mumbai Index would most likely test the 200-day EMA level at 18,800. In Friday’s trading in Asia the low for the day was 18,811 which is close enough. The key question is whether this level will provide support as Asian policy makers are grappling with inflation and those hedge fund and portfolio managers who are big EM fans are all about upward momentum and will, at least in the short term, tend to sell first before pondering the longer term benefits of Indian equities. Undoubtedly this is a market to be in for longer term asset allocators but just as the Hong Kong market is often a canary in the coal mine for large scale exits out of "riskier" markets, it is now worth monitoring BSESN closely in coming sessions.
The Daily Form commentary pointed to the potential for a rout in the muni market for a long time and included this comment from the December 15 newsletter.
Readers will recall that I have been bearish for a long time on CMF, the exchange traded fund which tracks California’s municipal debt, and as with MUB this chart seems to have the remarkable capacity to keep seeking out lower prices.
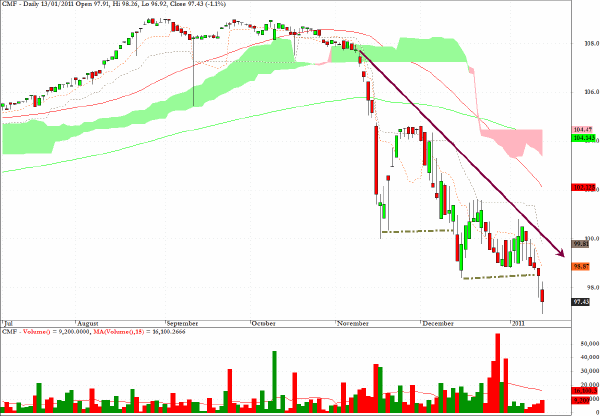
Also from the December 15 column was this comment.
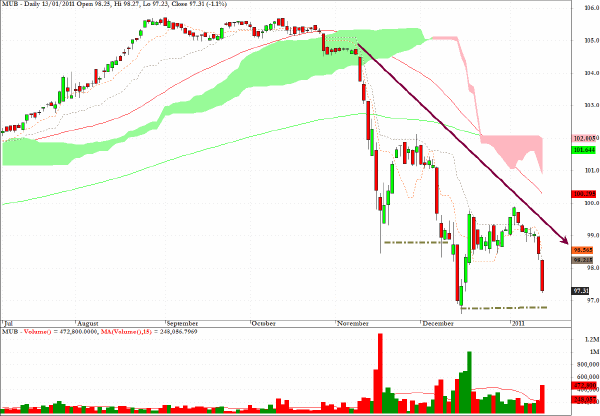
The chart for MUB reveals the dramatic drop in the market’s appetite for municipal debt within the US and the appropriate posture would be one of seeing any rallies as selling opportunities.
Once again the downward staircase pattern embedded within a descending wedge is a reliably bearish signal.
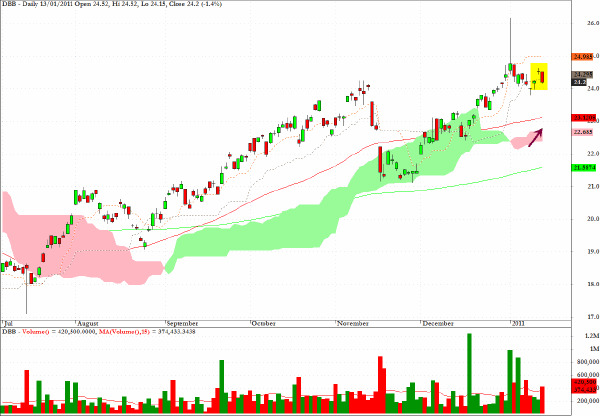
The exchange traded fund DBB which is a useful proxy for spot prices in the industrial and base metals sector printed a rather striking gravestone doji candlestick recently and may just be one immediate casualty of the tighter Chinese monetary policy.
On that subject a long position in CYB is also worth contemplating in the near term, especially in view of the Chinese premier’s visit to Washington next week.
Clive Corcoran is the publisher of TradeWithForm.com, which provides daily analysis and commentary on the US stock market.
|