| Corcoran Technical Trading Patterns For January 18 |
| By Clive Corcoran |
Published
01/18/2011
|
Stocks
|
Unrated
|
|
|
|
Corcoran Technical Trading Patterns For January 18
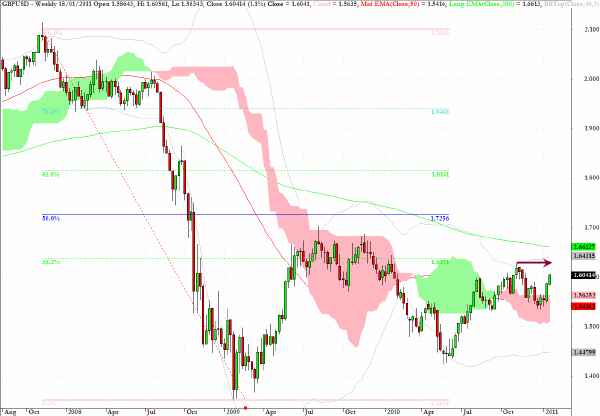
GBP/USD has broken out on its intraday charts and as the long-term weekly chart below suggests there is now a feasible intermediate-term target of a potential retest of the high just below $1.63 seen on November 5 last year.
Reviewing the fibonacci grid on the chart, it is notable that sterling has been below the 38% retracement level of the larger scale high/low range seen on this chart since dropping below the weekly pink cloud formation at the beginning of 2010. The actual 38% target would be around $1.6380, and also visible on the chart is the 200-week EMA target at $.166 which I suspect may be a bridge too far in the foreseeable future.
Concerns about the accelerating rates of growth in the RPI and more specifically the CPI are encouraging traders to think that the BOE may be contemplating a rate hike. However the housing market remains fragile and any forthcoming weak economic data could easily dampen the anticipation of a tougher monetary policy. For the time being one could go with the flow on the long side, but sterling will be living dangerously now that it is back above the pivotal $1.60 level.
For any readers who are based in the UK, or visiting London this week, I'll be making a presentation to the CFA Institute at Canary Wharf tonight. The subject matter will focus on inter-market quantitative analytical tools, including the correlation studies which have been featured here recently.

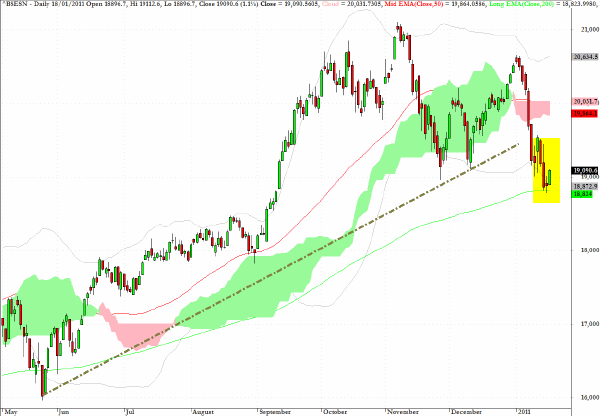
The Mumbai Sensex Index (BSESN) found support at the 200-day EMA as discussed here recently.
It is significant that Goldman Sachs is becoming more cautious on the BRIC economies and is (rightly) focusing on the fallout in many areas of the overall Emerging Markets (EM) sector as a result of rising inflation.

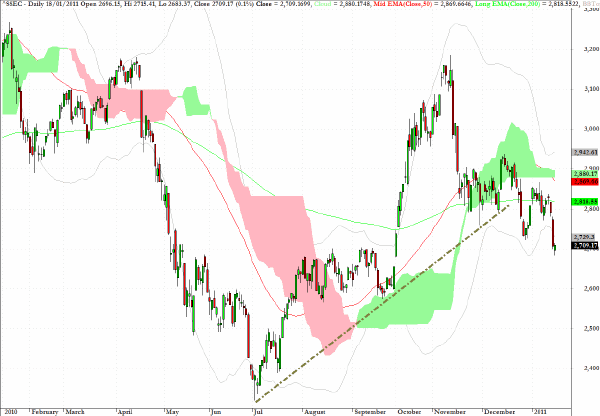
The Shanghai Composite Index stalled in Asian trading on Tuesday morning, but as the chart below reveals a key uptrend line (similar to that seen for the Mumbai Index shown above) has been broken and the Chinese market may be in the vanguard of a BRIC retreat.
As mentioned here yesterday there are numerous ETF’s which provide access to the BRIC’s and other EM sector exposure, but one has to differentiate between those which may fall out of favor (temporarily), and those which are still relatively attractive and have not yet been huge beneficiaries of the zealous pursuit of BRIC inspired momentum strategies.

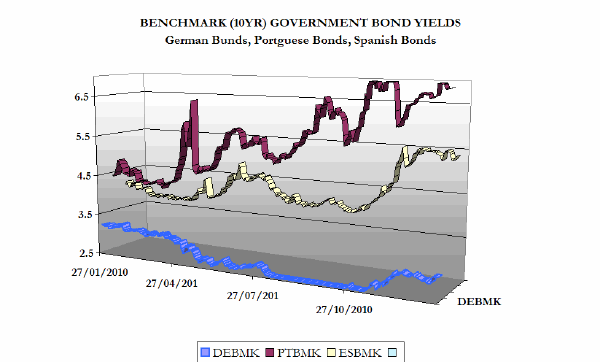
The following 3D chart illustrating the trajectories of the benchmark (10-year) government bonds of Germany, Spain and Portugal over the last year is one of the graphics which I'll be featuring on Cantos TV later today - and which can be viewed online at their site and also at Reuters Insider.
All rates have continued to move upwards - although there is some suggestion of a leveling out at current levels. Not immediately apparent, because of its lower absolute magnitude in percentage terms, is the continuing uptick in the yield on the German bund which is currently trading above 3.07% and at its highest level since April 2010.
This does not appear to be dampening enthusiasm for the DAX, however, which continues its relentless journey higher and is currently up one percent in European trading at around 7150. While I am not shy about pointing to good calls that this commentary makes from time to time, I have to admit to being wrong several times on misreading this index and sensing that a correction was imminent.
The highest close on the DAX was seen on July 13, 2007 at 8092 and given the current level of bullishness one has to take seriously the possibility that a move back to the historic high could be a target during the course of the next few months - even weeks!

Clive Corcoran is the publisher of TradeWithForm.com, which provides daily analysis and commentary on the US stock market.
|