| Corcoran Technical Trading Patterns For January 20 |
| By Clive Corcoran |
Published
01/20/2011
|
Stocks
|
Unrated
|
|
|
|
Corcoran Technical Trading Patterns For January 20
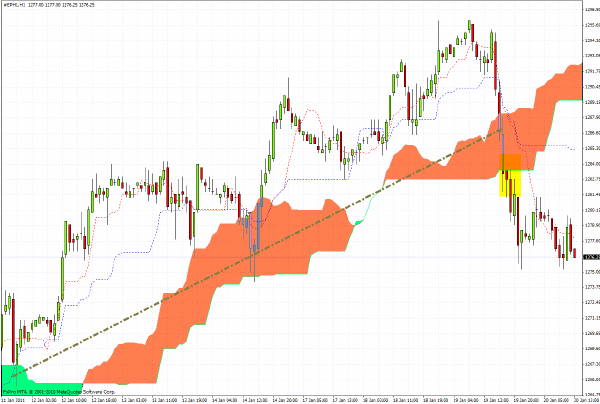
The hourly chart below for the S&P 500 futures shows that the 1275 level is being quite robustly tested during European trading.
Also notable is the break of the dotted trend line and the fall below the cloud formation during yesterday’s trading. As previously suggested earlier this week the selloff in China, India and to a gathering extent in Brazil, could be the precursor to a more risk averse environment in coming weeks. I'll repeat my overall perspective on US equities - while the longer-term outlook suggests that a move towards the high 1300’s is certainly feasible this year, the easy money since the March 09 recovery is behind us and there is rather too much complacency factored into current prices.
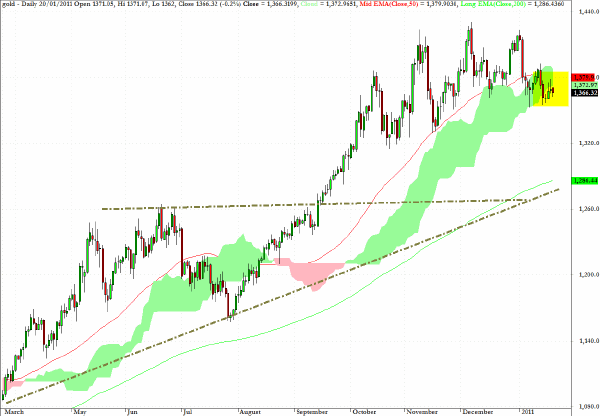
Spot gold has now penetrated cloud support on the daily chart and could be ready for a corrective phase which could potentially see a retreat to the mid $1270 area. Even if it retreats to the 200-day EMA level on the chart the longer term uptrend line would not have been violated, with an underlying bull market prognostication still valid.
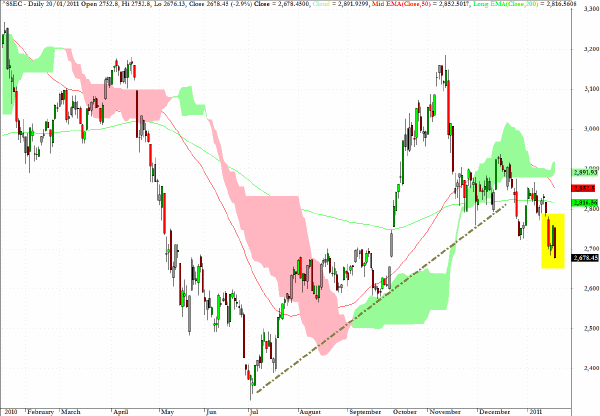
The Shanghai Composite Index sold off again in Asian trading - pulling back almost 3% which reversed the gains made in Wednesday’s session. Also notable, as commented earlier this week, is the manner in which the 50-day EMA has turned sharply down with the potential for a "death cross" of the 200-day EMA.
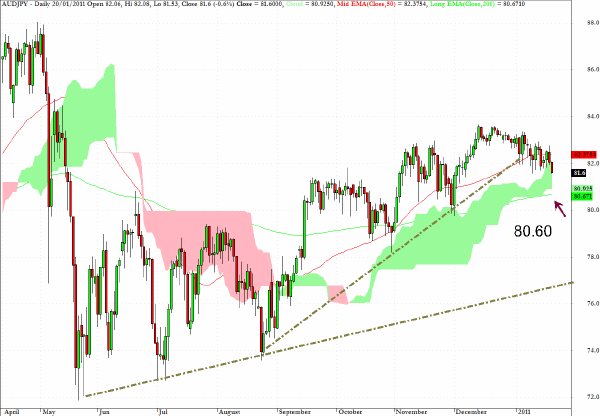
I'll be a guest on CNBC’s European Closing Bell this afternoon and, time permitting, will discuss the chart below for AUD/JPY. As regular readers will know, I find this particular cross rate fascinating and somewhat predictive of risk appetite in general.
I have marked a couple of trend lines which, I believe, are significant. The first, which tracks the rising lows from mid-August of last year, has now been broken while the longer-term line is still clearly intact.
The 80.60 level is quite critical for this cross rate and a break below that would not only drop us below the cloud formation but also the 200-day EMA, setting up a potential for a test of the longer duration uptrend line around 76.50.
If the BRIC and EM markets were to continue their selloff I would expect this lower level to be tested but I would also expect there to be a serious effort to mount a rally at the 200-day EMA level around 80.70 beforehand.
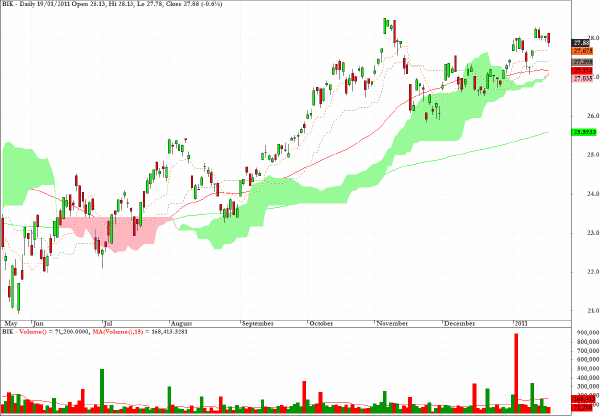
BIK, one of the sector funds which track the BRIC economies, could be in the process of registering a double top formation. If there is an exodus under way from these high momentum economies then this fund is one way to position oneself for an intermediate-term correction, even though longer term the long side is still the preferred stance.
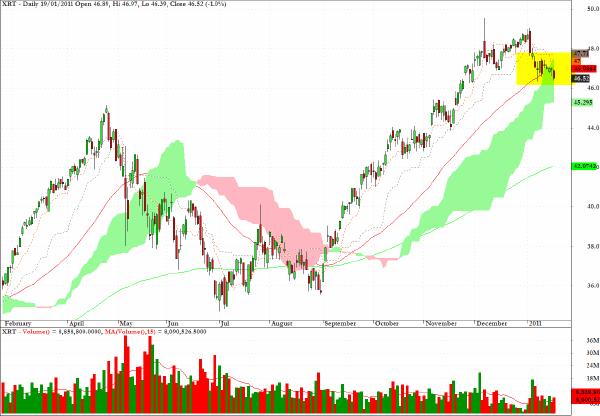
XRT, an ETF for the retail sector, shows some technical weakness following yesterday’s action. The close is below the 50-day EMA and has now entered the cloud formation after a rather extraordinarily bullish run since the beginning of last September, which echoes that seen on most US equity ETF’s.
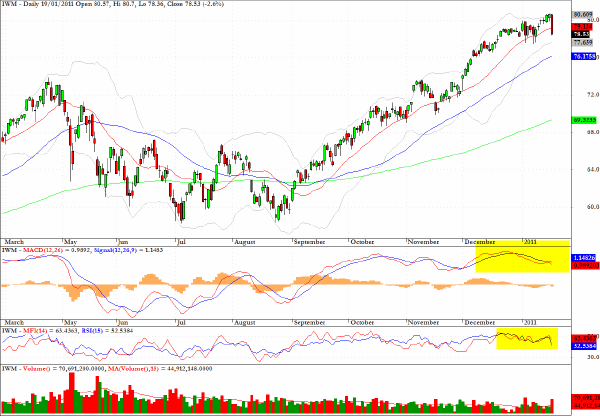
IWM is the exchange traded proxy for the Russell 2000 and was one of the worst performers in yesterday’s equity selloff. As I have indicated here previously this index has a relatively high beta and while it will outperform the broader S&P on the way up, conversely it will underperform on the way down as well.
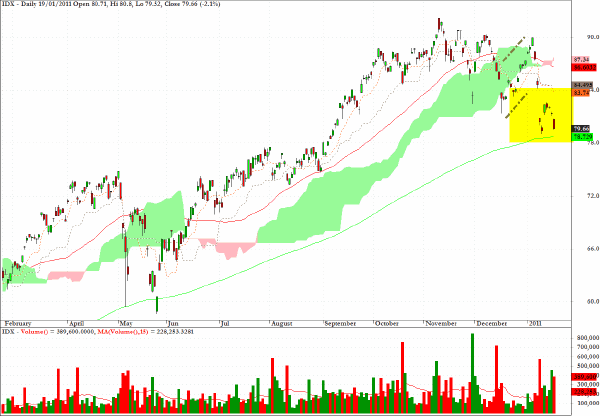
The attrition which is taking place in several key EM markets is also revealed in the exchange traded fund which tracks Indonesia equities. Here are comments from a month ago and coincidentally my last newsletter of 2010 (dated December 21) which still seem apt.
IDX, which tracks Indonesian equities, after registering a series of lower highs may be headed for a test of the base of the cloud formation and even further towards the 200-day EMA which also coincides with a support level on the daily chart.
There appears to be a gradual attrition in several of the newer emerging markets and in line with my comments about the Brazilian index it may be that a process of capital withdrawal from these high flying markets may be under way.
Clive Corcoran is the publisher of TradeWithForm.com, which provides daily analysis and commentary on the US stock market.
|