| Corcoran Technical Trading Patterns For January 21 |
| By Clive Corcoran |
Published
01/21/2011
|
Stocks
|
Unrated
|
|
|
|
Corcoran Technical Trading Patterns For January 21
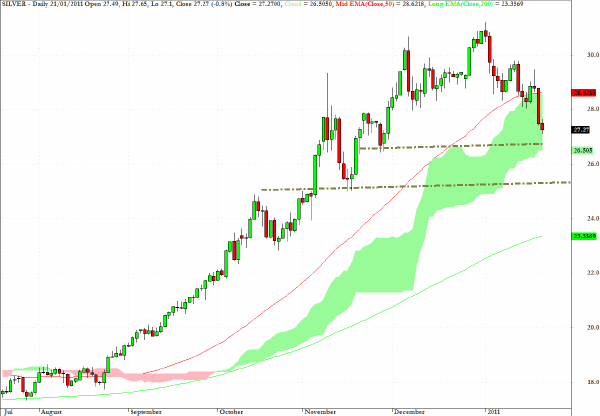
Spot silver reached an intraday high of $31.22 on January 3 and has subsequently dropped by more than ten percent. As discussed on January 12, it is now feasible to contemplate that traders will want to target tests at both the base of the cloud formation at $26.50, and also the lower dotted line close to $25.
Here again are comments from the January 5 newsletter.
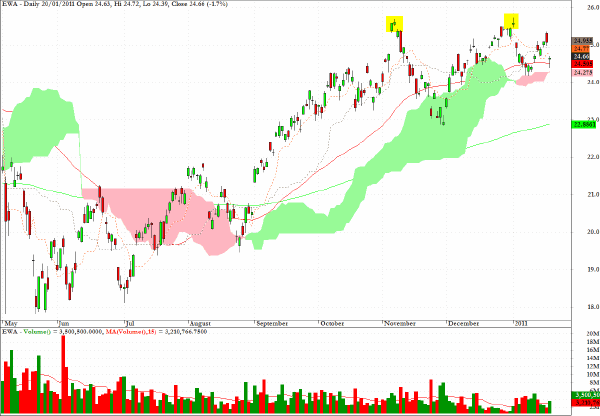
EWA, an exchange traded fund which tracks the MSCI Australian index, has a formation which might reveal itself in coming sessions as an intermediate-term double top. It is also worth pointing out that EWA is very highly correlated with AUD/JPY and AUD/USD.
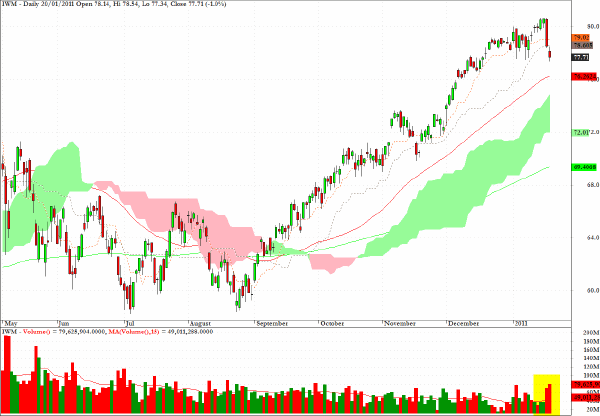
IWM gapped down in yesterday’s session and the volume is picking up on this corrective action.
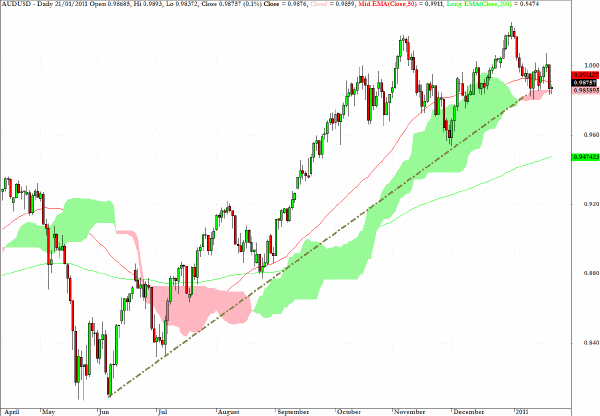
AUD/USD is at a critical level where a break below the very thin cloud formation (which indicates that there is little support offered by this pattern) would also violate the upward trend line drawn.
Although I am not yet ready to pull the trigger, weakness in today’s session could present an intermediate-term trading stance on the short side with a target of 0.95 - also coincidental with the 200-day EMA.
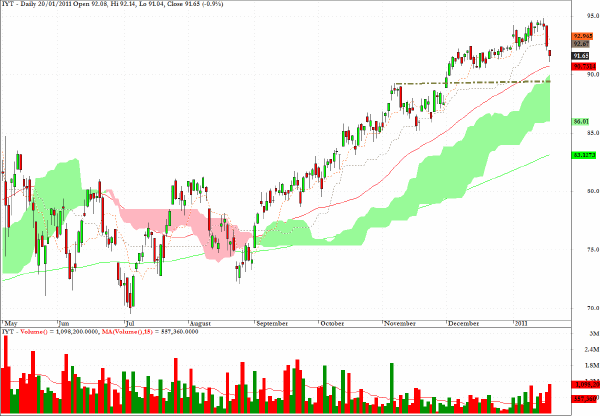
IYT, an ETF which tracks the DJ Transportation sector, has sold off for two sessions on increased volume but has chart support at the level indicated by the dotted line.
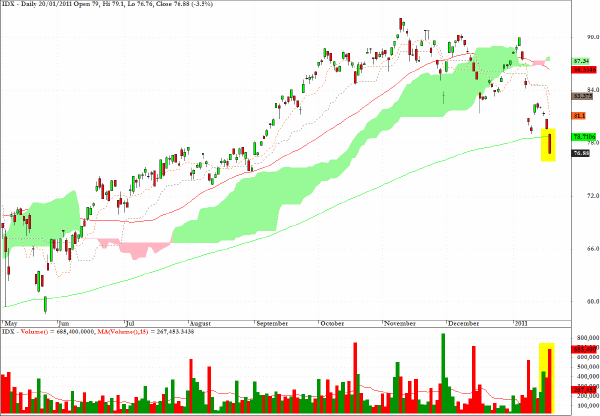
Further to yesterday’s comments, IDX, which tracks Indonesian equities, the weak technical pattern has now registered a decisive break below the 200-day EMA.
Clive Corcoran is the publisher of TradeWithForm.com, which provides daily analysis and commentary on the US stock market.
|