| The McMillan Options Strategist Weekly |
| By Lawrence G. McMillan |
Published
01/21/2011
|
Options
|
Unrated
|
|
|
|
The McMillan Options Strategist Weekly
The stock market has finally shown some signs of weakening. Is it just a minor correction or has a more severe downturn begun? Let's look at the individual indicators in order to answer that question.
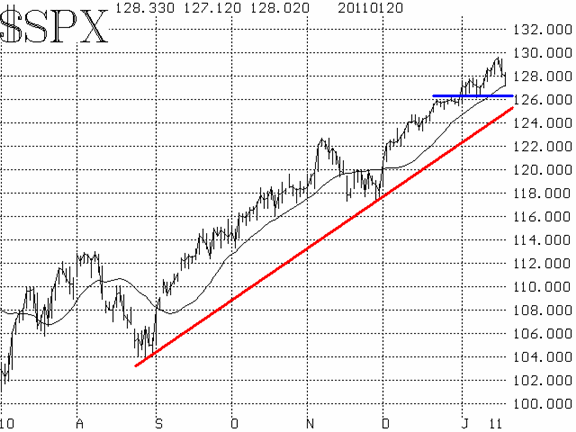
First, the all-important chart of $SPX remains bullish. A close below 1262 would be required in order to turn this chart bearish.

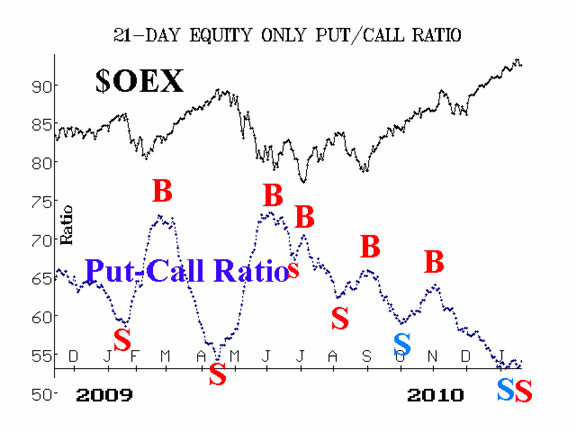
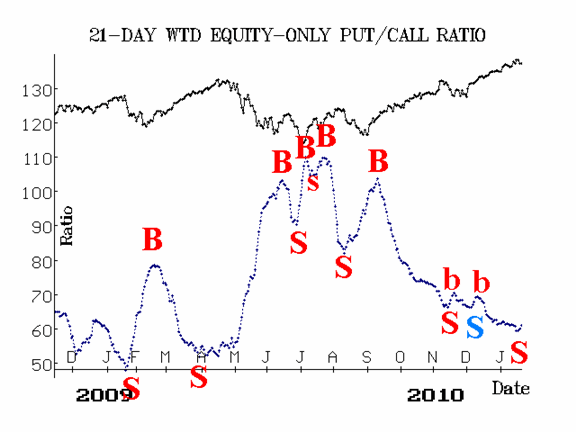
Both equity-only put-call ratios have now moved to sell signals (see Figures 2 and 3).

Breadth was poor, not only on Wednesday -- the first big down day in a long time -- but on Thursday as well (even though the market rallied back to nearly unchanged on Thursday). Breadth indicators are on sell signals as well.

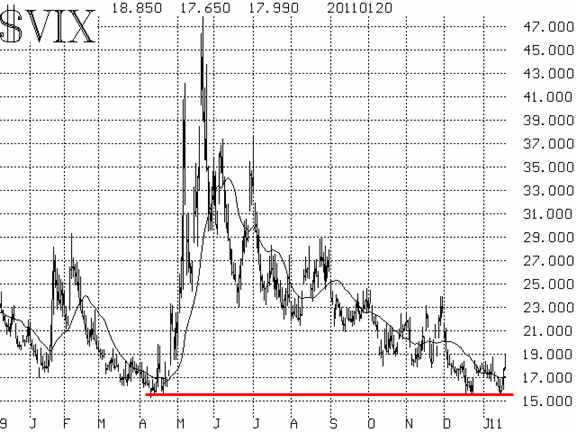
$VIX edged higher this week, but did not exceed the December highs, which as a minimum, would be required to turn it bearish.

The bottom line is that unless or until $SPX breaks support, these various sell signals are nice to know about, but not worth acting upon. However, a break below 1262, while these sell signals remain in place, could augur in a very nasty decline.
Lawrence G. McMillan is the author of two best selling books on options, including Options as a Strategic Investment, recognized as essential resources for any serious option trader's library.
|