| Corcoran Technical Trading Patterns For January 24 |
| By Clive Corcoran |
Published
01/24/2011
|
Stocks
|
Unrated
|
|
|
|
Corcoran Technical Trading Patterns For January 24
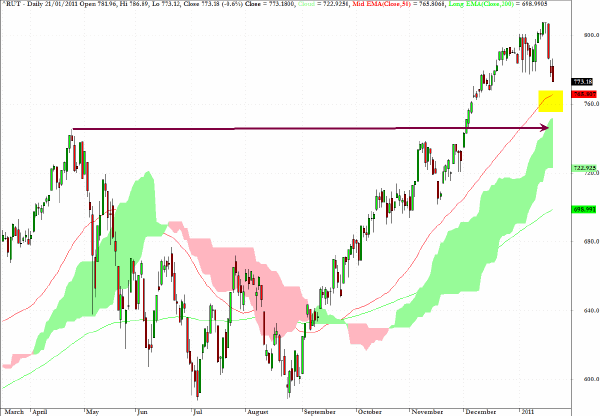
As commented last week the best sectors to be short when markets correct are those with high beta and this is certainly a characteristic of the Russell 2000. So far the correction has been mild, and I am still not advocating any aggressive short positions in US equities on the simple premise that it is not prudent to go against the grain as far as ongoing POMO operations from the Fed are concerned.
I have voiced concerns in this column and elsewhere recently that the "supportive" action of government programs has a way of removing the clarity of price discovery in market dynamics and to that extent also raises some issues for technical analysts.
Reviewing the chart below one could easily make the case (in more "normal market conditions") that the current corrective mode could easily see the index retreat towards the 740 level, as indicated by the arrow on the chart, as this marked the top in April as resistance and now needs to be tested for potential support. But there have clearly been large rewards for funds and prop trading desks to "get ahead" of the Fed and reap easy rewards as a consequence of the almost daily purchases of Treasuries providing an underpinning of macro liquidity which allows equities to keep rising. Under such a scenario I have been less active in taking positions with regard to US equity indices so far this year, and prefer to focus more on ETF’s from different geographical sectors as well as opportunities in FX and commodities.
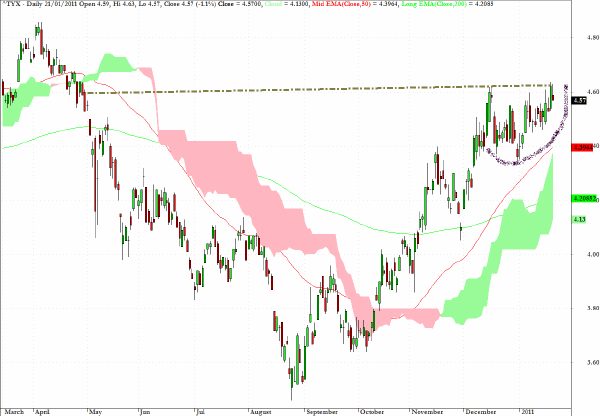
The daily chart which captures the yield on the longest maturity UST reveals a handle-like formation which appears to be ready to test the 4.6% level. Although the cup/handle pattern has proven to be a reliable indicator and precursor for breakout patterns in individual equities and ETF’s, it should be used with more caution with regard to yield levels.
Longer term the outlook for UST’s seems, on balance, to be one where lower prices and higher yields lie ahead and this would seem to especially true at the furthest end of the yield curve, i.e. the 30-year bond.
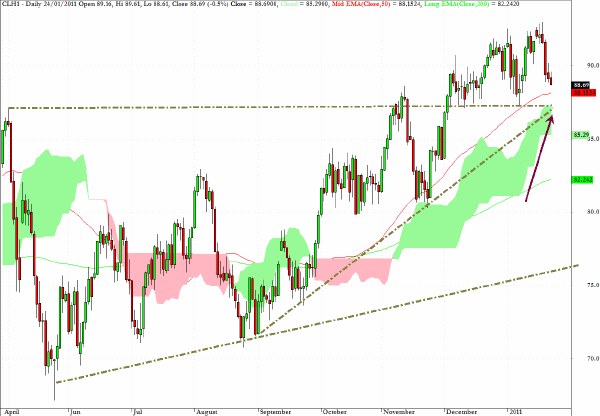
The chart below shows the current price level at the time of writing (during trading in Europe on Monday morning Jan 24) on the March contract for WTI.
After almost touching $93 on March 19 crude has retreated back towards a potentially strong support level as indicated by the intersection of the two trend lines drawn on the chart as well as the daily cloud formation.
I would expect to see buying support come in around the $87.20 level and a target price of $90.60 or thereabouts is supported by the Ichimoku cloud projection which indicates a likelihood of moves back towards this level in coming sessions.
The one qualification that I would insert to this near-term forecast would be a failure to find support at the $87 level and I would then be prepared to stalk for a short position on a break below $85 with a feasible target of $82.30 which coincides more or less with the 200-day EMA.
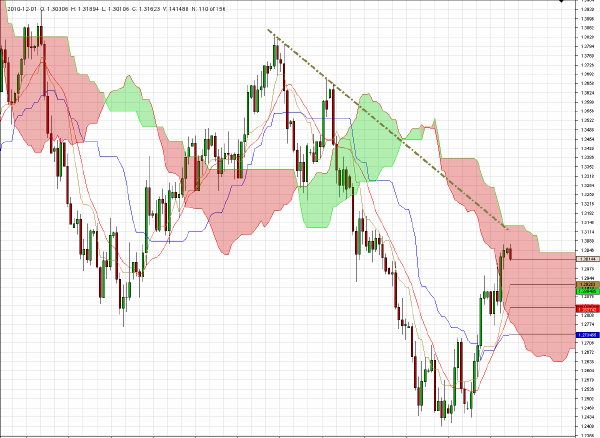
The euro has staged a rather remarkable recovery over the last two weeks and clearly the single currency has keen buying support (most likely from the PBOC among others) at the bottom of the recent range around $1.29.
While there could still be room for further upside for EUR/USD (but not much as I expect that $1.37 will be a difficult hurdle to cross), I am favoring a short EUR/CHF position.
The cloud formation on the daily chart suggests a relatively attractive reward/risk ratio with a feasible 200-pip gain and with less than a 100-pip risk from the levels depicted on the chart below.
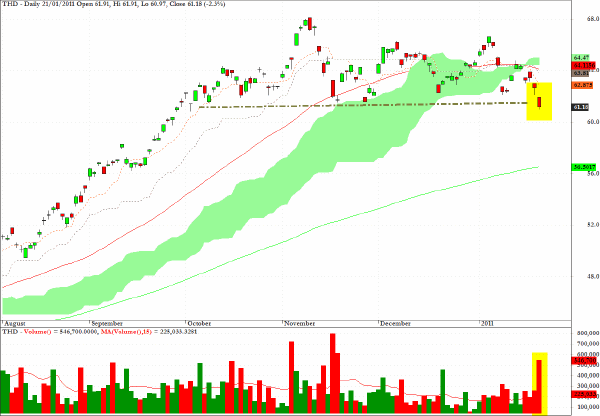
THD, which tracks the MSCI index for Thailand, dropped below a key chart level in Friday’s session and coupled with the clear break down from the cloud formation, suggests that lower prices lie ahead...with a feasible target at the 200-day EMA level.
In Asian trading on Monday the Dow Jones Thailand Index fell by 1.7% so care should be taken to find an appropriate entry level on any rebound rallies in coming sessions.
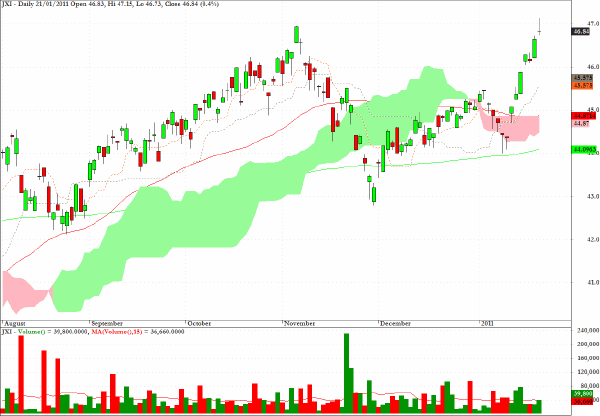
JXI, a sector fund for global utilities, displays a gravestone doji pattern from Friday’s trading and could have registered a double top at the $47 level.
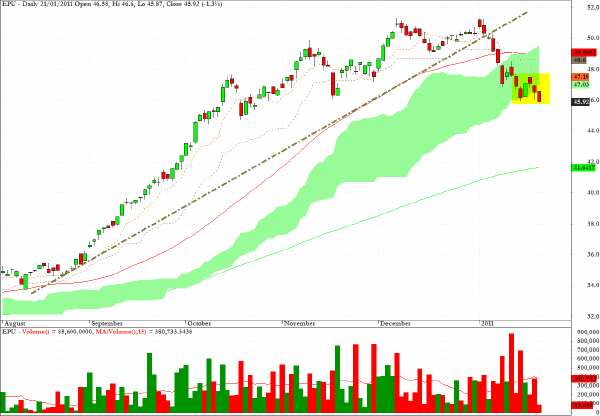
EPU is an exchange traded fund which provides access to Peruvian equities and, in turn, in similar fashion to the fund ECH which tracks the Chilean stock market, is also a good surrogate for exposure to basic materials and industrial metals, especially copper.
The technical condition of the chart below also would suggest that the 200-day EMA level at approximately $42 could be a target for nimble short sellers or an entry point for those looking to benefit from a probable rally when this level is attained.
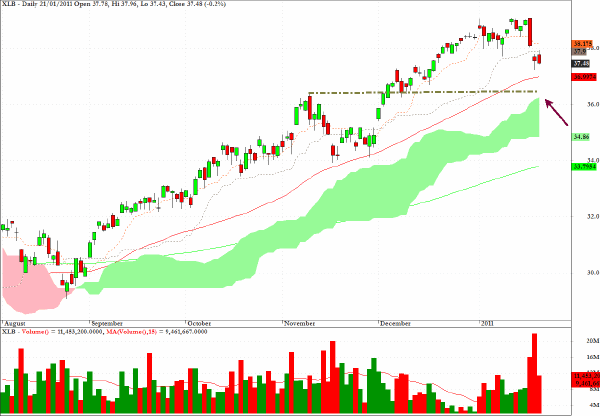
XLB, an ETF for the industrial materials sector, has a chart resistance/support line as well as Ichimoku cloud support at the level indicated by the arrow on the chart.
Clive Corcoran is the publisher of TradeWithForm.com, which provides daily analysis and commentary on the US stock market.
|