NASDAQ Commentary
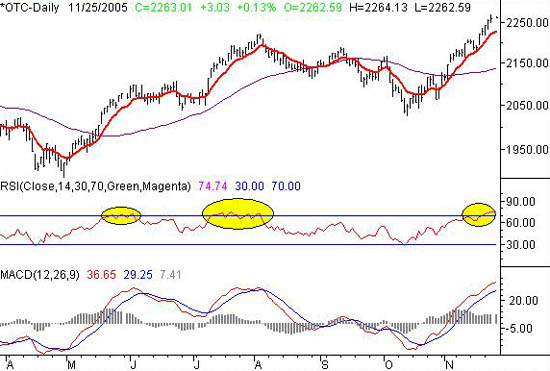
The NASDAQ's close at 2263.01 last week was the highest close we've seen in years, topping the prior week's close by 35.94 points. That 1.6% gain was huge, especially considering that the trading week was cut short by a day and a half. But as we discussed in recent updates, the composite is now at the point where we have to question if it can keep going without a break.
Our answer to that question is - not likely. That's not to say we're planning on the NASDAQ to come crashing down. Rather, we're just seeing the bulls run out of steam....it's a familiar pattern. Just look back to late May and early July for previous examples. The index would surge, then peak, then dwindle for a few days while the 10 day moving average (red) would catch up. In May, it was just a short sideways period. In July, however, the NASDAQ's big rally set up a rather big pullback. A repeat of one of those two scenarios is our concern now, especially with the size of divergence we see between the 10-day average and the composite itself.
So, while we mentioned it last week, we'll say it again - the 10 day line is the inflection point. Either it will support the NASDAQ, or it won't. Either way, we do expect to see the index fall back to that line pretty soon. It's currently at 2227.65, or 36 points under the NASDAQ's close. If that number rings a bell, it's because that's the size of last week's gain. That means we could almost give up an entire week's worth of work if that correction is made. If support is found at the 10 day average, it should be a very merry Christmas for the bulls, as the NASDAQ treks further into new high territory. If support is not found at the 10 day line, we expect it to be found somewhere around 2200 anyway.
On our chart we've added an RSI analysis to illustrate how this overbought situation compares to the last two similar setups.
NASDAQ Chart

S&P 500 Commentary
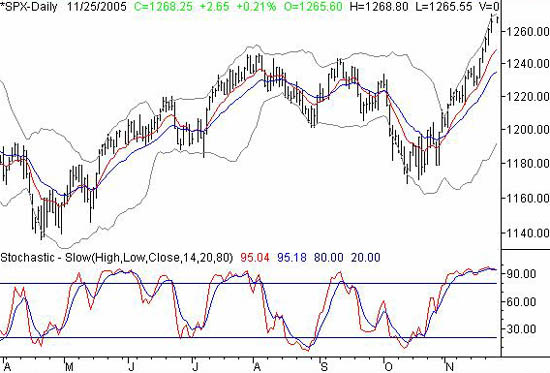
The S&P 500 also closed at multi-year highs, by ending the shortened week at 1268.25. That 1.6% rally matched the NASDAQ's, but also left us asking the same question - can things continue at this white hot pace? As with the NASDAQ, we think not. However, that's far from a bearish expectation.
On our chart today, we've added a 20-day Bolinger Band (the gray lines surrounding the index portion of our chart) to show you an important reversal signal. The Bollinger Band has two functions....as a momentum indicator, and as a a reversal indicator. When the index keeps pressing up and into the upper band and forces it higher - as it did for most of November - it's a sign of momentum. But when it finally eases up and starts to fall under that band, it's a sign that the gas tank is empty. To a certain degree, we got such a pattern on Friday. After hitting the week's high of 1270.65 on Wednesday, the SPX wasn't able to reach that upper band on Friday.
As we said above, this is far from a certain bearish outlook......we're just saying that this is how pullbacks start. It's particularly important to note, however, as we're seeing that pattern at the same time both of the stochastics lines are rolling over, and at the same time that the S&P 500 is 19 points above its 10 day line. That's the biggest separation we've seen in a long time, and given that the last twelve months have been nothing but back-and-forth chop, it's tough to think that things will be much different this time.
As for the likely landing point of any dip, the 10 and 20 day lines at 1249 and 1235 are the first line of defense.
S&P 500 Chart

Dow Jones Industrial Average Commentary
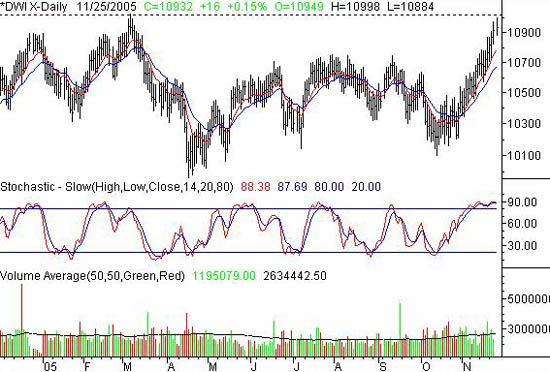
The Dow was the only index to make higher highs on Friday, reaching 10,998 before ending the week at 10,932. That locked in a 166 point gain (+1.5%) for the abbreviated week from the index we least expected it from. That said, the Dow is still showing signs of resistance here. The peak at 10,998 was just a hair under March's peak at 11,027. Plus, we've seen how big, round numbers like 11,000 can influence the way traders think....and trade. So with recent tops near that 11,000 mark, we're going to draw a major line in the sand there.
We do think the Dow will get past that mark by the end of the year, but we don't think it will be able to do so without a rest. Again, the 10 and 20 day lines (at 10,786 and 10,676) are best poised to send the Dow higher when and if we start a correction. On the flipside, if the Dow can muster a couple of closes above 11,000 first, we'll be looking for a continuation of this buying spree. No targets yet though.
Dow Jones Industrial Average Chart

Price Headley is the founder and chief analyst of BigTrends.com.