| Corcoran Technical Trading Patterns For January 31 |
| By Clive Corcoran |
Published
01/31/2011
|
Stocks
|
Unrated
|
|
|
|
Corcoran Technical Trading Patterns For January 31
Friday’s trading in the US was very much held captive by the events unfolding on the streets of Cairo and other Egyptian cities. Many traders would have been monitoring events via the live feeds from Al Jazeera and other news services and it was hard not to assume that some momentous changes lie ahead for not only the largest state in the region (90 million people) but also a major cultural influence on the Arab world.
Security concerns and the uncertainty about the eventual outcome of the uprisings now being seen in other states in the region are likely to produce some emotional trading activity in the weeks ahead. Generally speaking the lack of any clarity regarding the repercussions will tend to keep the animal spirits in check and there will be more investors/traders erring on the side of risk off rather than risk on .
While certain overseas markets have shown sharp moves in trading on Monday there has perhaps not been the larger disruptions that many were expecting. But this could be the quiet before the storm.
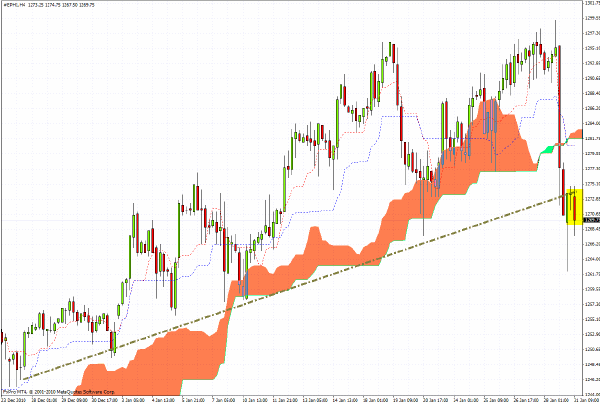
The 240-minute chart for the S&P 500 eMini Futures (March contract) show that the drop below the trend line illustrated, and down towards the 1260 level, must now raise the possibility that lower levels will need to be revisited to test the conviction of the equity bulls. My suggestion is that while the index remains below the 1280 level I would be tempted to fade sudden rallies but be prepared to take profits or losses quickly.
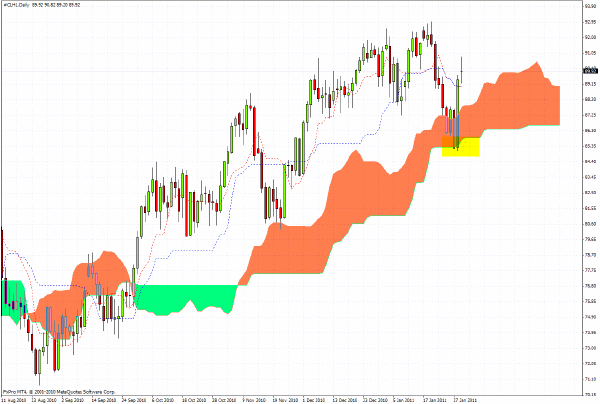
A week ago I commented on crude oil and suggested that the base of the cloud formation on the daily chart should provide support and that, absent a drop below $85, I would suggest a long position with a target of $90.60. So far in today’s trading we hit $90.82 enabling me to exit the position with an attractive return.
One would expect this market to remain volatile in coming days and only intraday opportunistic trades with a bias towards buying any serious setbacks would be the recommended approach to trading this commodity at present.
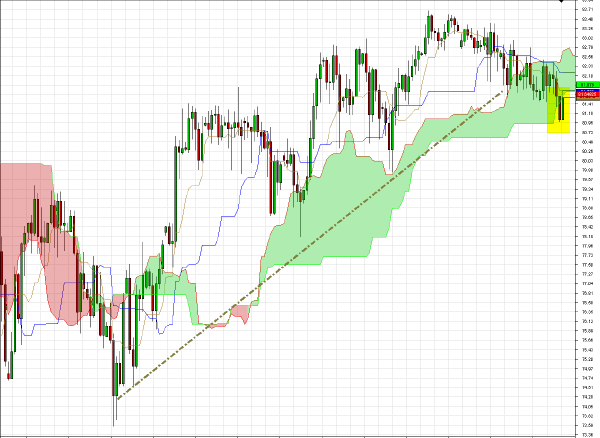
The 240-minute chart for AUD/JPY shows the validity of using cloud formations as pivotal levels for anticipating support/resistance. The strength in the yen following the developments in Egypt has put the cross rate back in the spotlight from my perspective, and, while the base of the cloud provided support, my longer-term view is that 80.60 will need to be tested soon.
The outcome of that testing will, as previously stated here, provide valuable clues as to the overall risk appetite for the emerging markets and equities from a macro perspective.
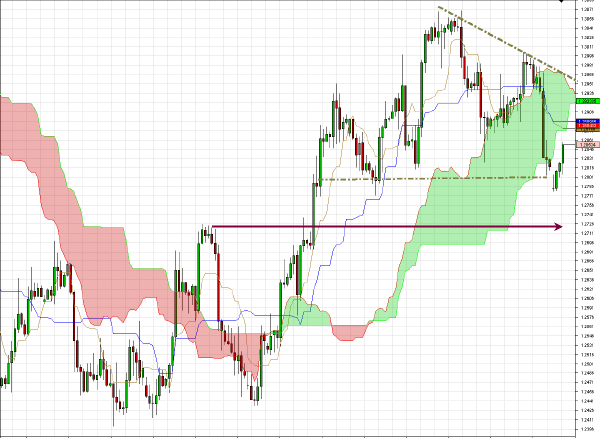
EUR/CHF has performed very much in line with expectations expressed here recently. The flight to safety dynamics will keep a firm bid under the Swiss Franc and I would be targeting the level indicated by the arrow on the chart in the intermediate term.
Also featured here last Thursday was the comment regarding Indian equities.
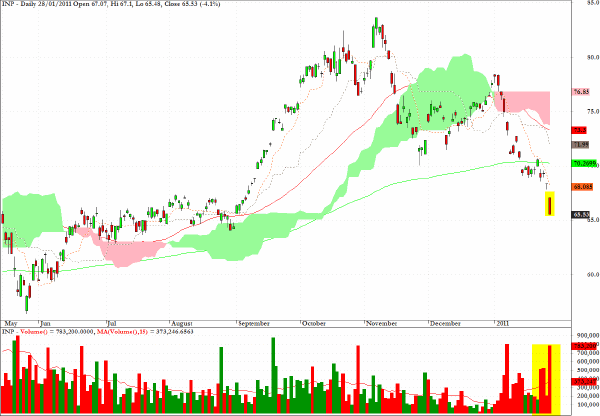
INP, which tracks the MSCI India index, has been featured in these columns recently and the drop below the 200-day EMA on the sector fund has now been reinforced by today’s close on the Mumbai exchange as discussed above.
In general I suspect that there may well be some serious rethinking taking place among major asset allocators regarding the risk/reward ratios for many EM markets given their out-performance during 2010 and the realization that adventurous investing is not necessarily the preferred course when geo-political factors are undermining confidence in the ability to preserve capital and hedge exposure in newer markets.
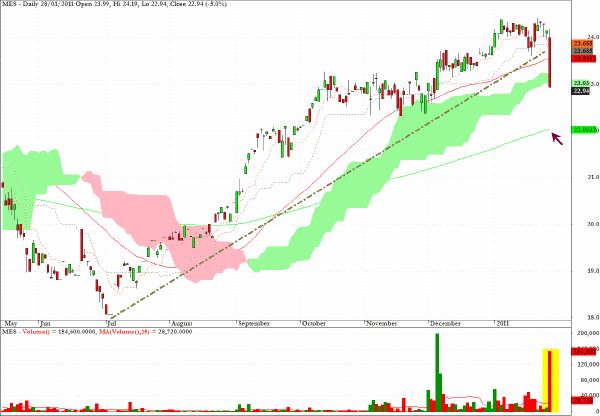
MES,an ETF providing exposure to the Gulf States region, is likely to trade erratically in coming sessions but such trading could produce sharp rallies as well as plunges.
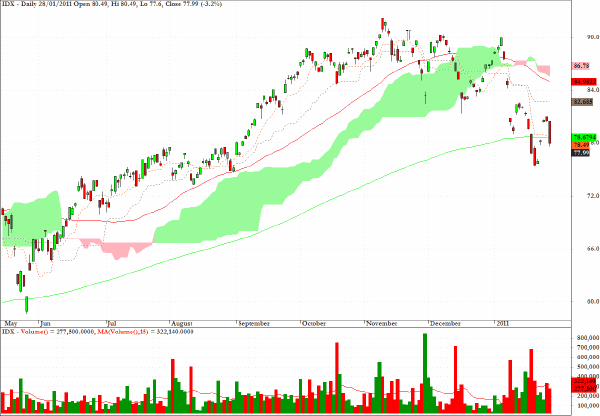
The following comments from last week on IDX have been validated by recent events and I would expect this fund to remain under considerable pressure in coming weeks
IDX, which tracks Indonesian equities, is behaving erratically and in my estimation draws attention to the more anxious tone which overshadows the confidence of the more adventurous asset allocators in emerging markets.
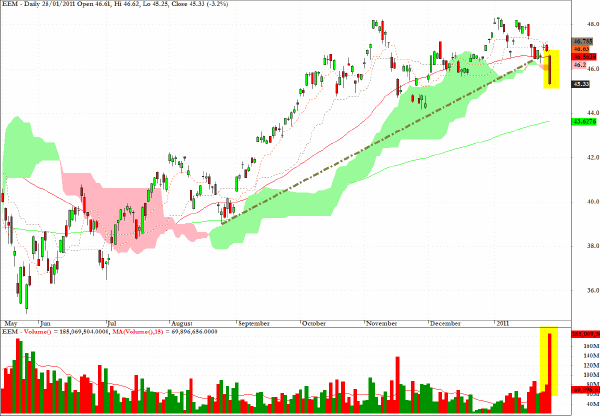
EEM has broken an uptrend line and a feasible target in coming sessions would be a test of the 200-day EMA.
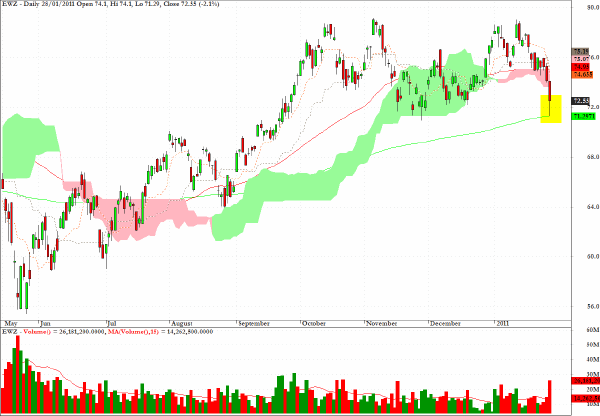
Late last year I wrote this comment regarding the exchange traded fund EWZ.
The chart for EWZ, which tracks the MSCI Brazil Index, may also be headed for a testing of the 200-day EMA.
Having touched the green line (i.e. the 200-day EMA) in Friday’s session this index would now be a candidate on my buy list of geographical ETF’s as I suspect that it will be, relatively speaking, less susceptible to fallout from the current developments in the Middle East.
Clive Corcoran is the publisher of TradeWithForm.com, which provides daily analysis and commentary on the US stock market.
|