| Corcoran Technical Trading Patterns For February 1 |
| By Clive Corcoran |
Published
02/1/2011
|
Stocks
|
Unrated
|
|
|
|
Corcoran Technical Trading Patterns For February 1
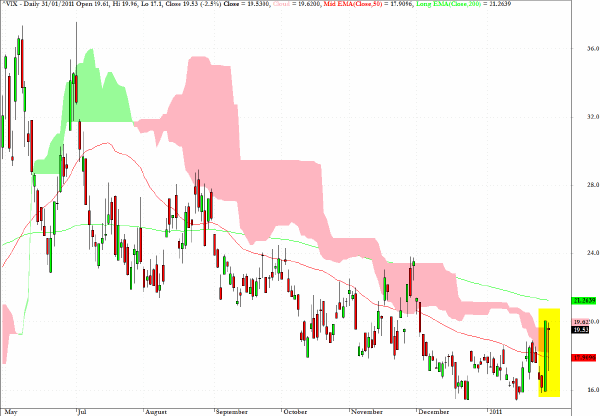
The CBOE Volatility Index or VIX, which expresses the implied volatility assumptions in option pricing for the broad US equity market, spiked up last Friday.
While this was to be expected given the adverse reaction that equities had on Friday to the unfolding events in Egypt, and which saw the S&P drop by 1.8% during that session, the action yesterday is divergent with the overall behavior in yesterday’s trading. Despite an advance in equities generally, and 0.8% specifically for the S&P 500, the VIX backed off substantially during the session but still ended the session near its highs.
Impressionistically from media chatter one had the sense that many market participants seem not to be at all fazed by the potential for disruptions in the Middle East - just keep buying the dips! - but the VIX as a useful barometer of market sentiment was sending a rather contrary message.
The rather unusual hammer candlestick formation would suggest that there are a lot of investors who are seeking out protective puts, and this may better characterize the "mood" of the market than the apparent complacency which was manifesting itself at the surface level for many asset classes.

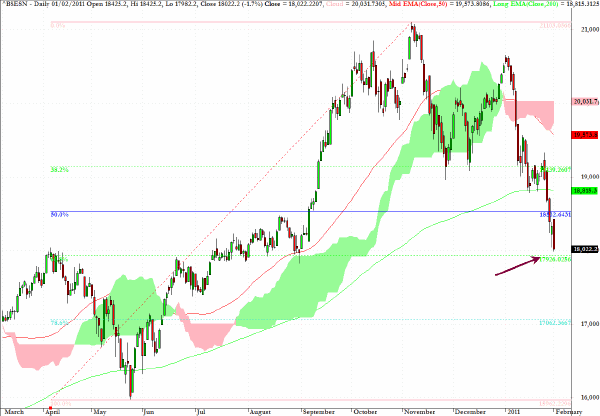
The Mumbai index continued its waterfall pattern in Asian trading on Tuesday (Feb 1). The index dropped below the 18000 level for the first time since last summer and closed near the intraday low - registering in the process a clear red trend day.
As can be seen from the fibonacci grid overlaid on the chart the index has retreated by almost exactly 62% from the high/lows seen on the chart. There is chart support in the vicinity of 18000, but, given the manner in which this index is out of favor by EM/BRIC investors, a case could be made that eventually there might be a need to re-test the 16000 level which is a more critical support level.

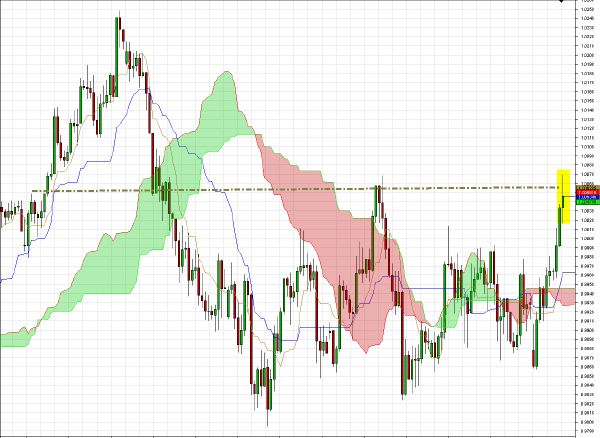
AUD/USD is currently challenging a key chart level in European trading, as can be seen on the 240-minute chart below. At present there would appear to be strong resistance to overcome at the 1.0080 level, but if this can be decisively penetrated then the late December highs around 1.0240 become a feasible target.
If we should make it back to the level - while the buy the dips sentiment prevails - it will be quite useful to see whether a double topping pattern unfolds or whether the Aussie dollar can continue to be in the vanguard of a risk on move which would usher in new breakouts for equities and commodities.

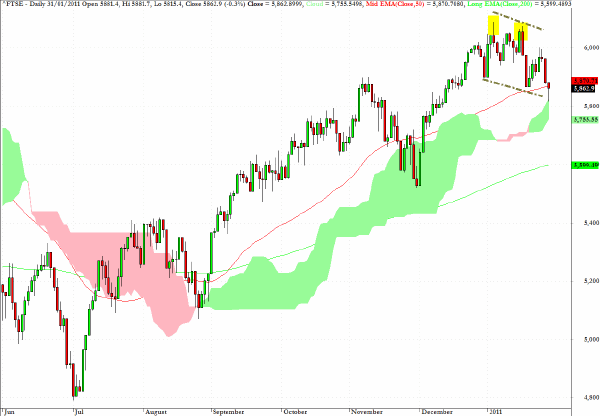
One of the more interesting formations for global equity indices is to be found on the daily chart for the FTSE 100 index in the UK.
Highlighted in yellow on the chart is a lower recent high and there is a trend line drawn indicating a series of lower lows as the index has tagged the top of the cloud formation. While there is a good possibility that the top of the cloud could provide a platform for another bounce back above 6000 it will be useful to monitor whether this index, which is more reflective of global equities (with a strong focus on metals and mining) rather than a good guide to the UK domestic economy, can reach back towards the intraday high of 6090 seen on January 6.

Clive Corcoran is the publisher of TradeWithForm.com, which provides daily analysis and commentary on the US stock market.
|