| Corcoran Technical Trading Patterns For February 3 |
| By Clive Corcoran |
Published
02/3/2011
|
Stocks
|
Unrated
|
|
|
|
Corcoran Technical Trading Patterns For February 3
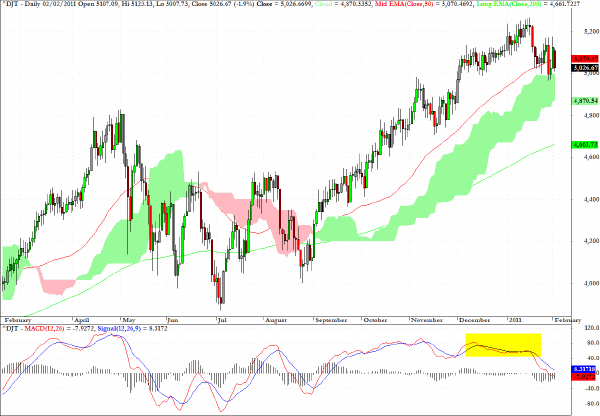
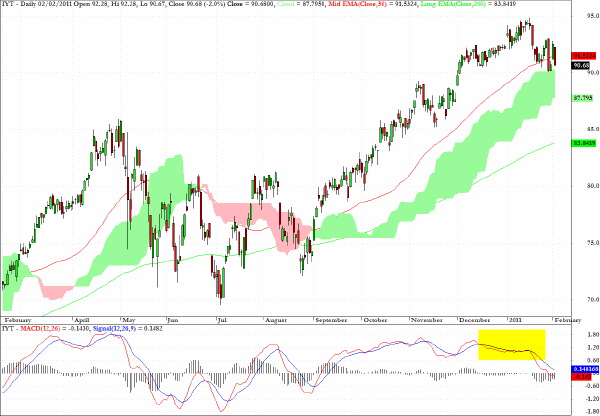
The daily chart below for the Dow Jones Transportation index has one of the least healthy appearances of the major US equity indices. Even though the tone of the overall market remains decidedly bullish there are a few negative technical divergences starting to manifest themselves which could become more significant in the medium term.
The highlighted part of the MACD chart shows a classic non-confirmation, from a momentum perspective, of the move up to the peak set on January 18, and the recent price behavior, including a 1.9% drop yesterday, will ensure that this index will be on my watch list in coming sessions.
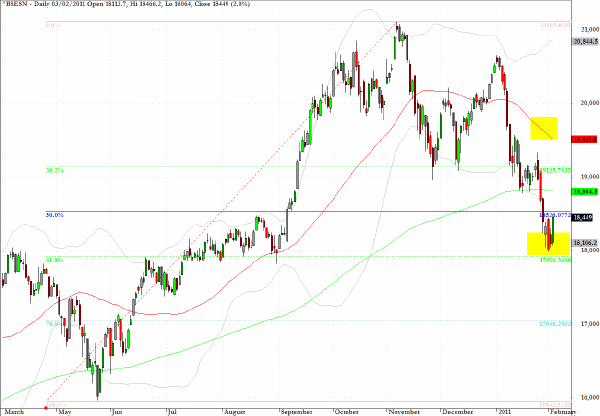
As discussed here earlier this week, the Mumbai exchange retreated almost exactly to the 62% retracement of the high low seen on the chart and today has bounced off the 18000 level. The quality of any further bounce will provide important clues not only about the likely direction of this key BRIC index in coming weeks but will also provide an insight into risk appetite in general.
I intend to discuss this chart on CNBC’s European Closing Bell this afternoon around 16:40 GMT.
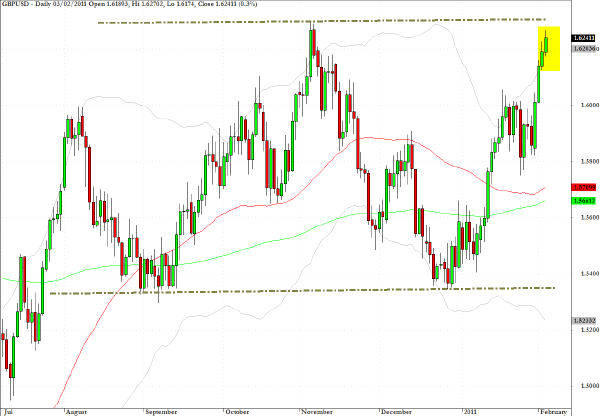
The chart below for GBPU/USD shows that sterling - much to my surprise - has moved higher into the trading range that has been in effect since last summer.
Following bullish data this morning sterling gapped up quickly towards the $1.63 level and is now testing resistance at the top of the range illustrated.
I took my losses quickly when sterling sustained its recent closes above $1.58 and I'll be nibbling at the short side today but prepared to abandon those positions on a close above $1.6350. As often discussed the so called cable rate is one of the most lively and appealing to trade but one has to be prepared to take losses as well as ride the very nice trend moves that show up in sterling from time to time.
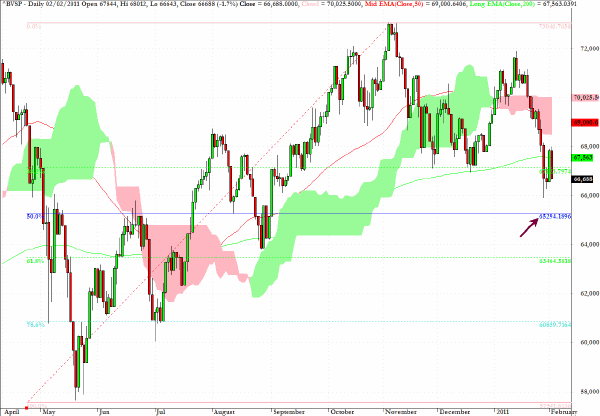
The Bovespa index in Brazil reversed most of Tuesday’s gains in yesterday’s session and once again has closed below the 200-day EMA.
I have also indicated on the fibonacci grid the 50% retracement level of the high/low seen on the chart and this level around 65,200 may prove to be an attractor which needs to be visited before the longer-term direction for this key BRIC index becomes more apparent.
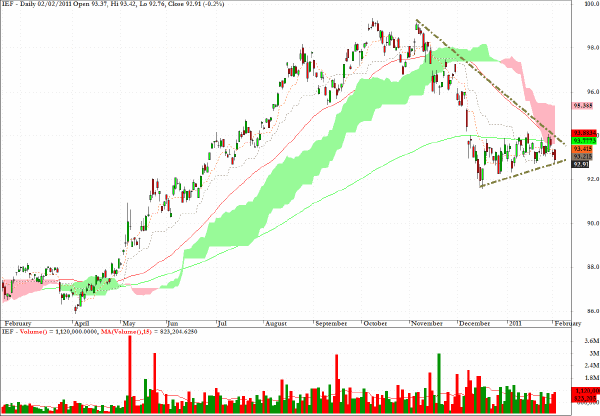
IEF, an exchange traded fund which allows access to prices of UST’s in the 7-10 year maturity range has moved into the apex of a rather bearish looking triangular pattern.
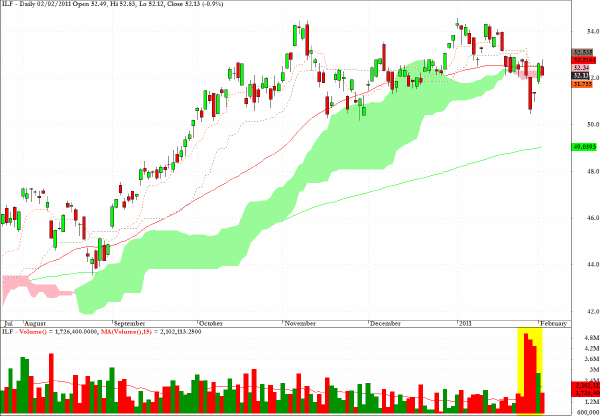
ILF is an exchange traded fund which tracks major Latin American equities, and the heavy red volume bars which have been highlighted raise the specter that there could be further weakness ahead for Latin American markets.
ECH the fund which tracks Chilean equities also has a negative tone.
IYT, an ETF which tracks the DJ Transportation sector, was mentioned in the Daily Form commentary on January 13th, which can be found here, and, in accordance with the comments above about the underlying index, this fund would seem to be a likely candidate to show relative weakness in comparison with the movement of other US equity indices.
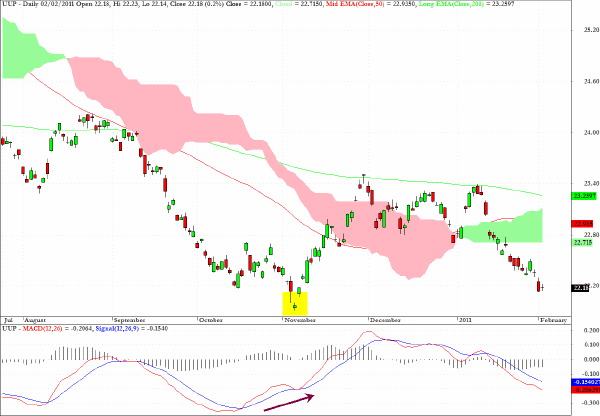
UUP, the ETF which provides long exposure to the US dollar index, is beginning to look sold out.
Also notable on the chart are the positive divergences on the MACD chart the last time a bottom was hit in November, and three is a clearly evident positive momentum divergence (marked by the arrow) and also the possibility that on a new basing pattern another even more positive MACD divergence would become evident.
While the fundamentals continue to remain bearish for the US currency, there is an awful lot of good news that has been baked into the euro’s recent performance and also sterling could suddenly develop one of its frequent attacks of vertigo.
Below is my comment from January 20.
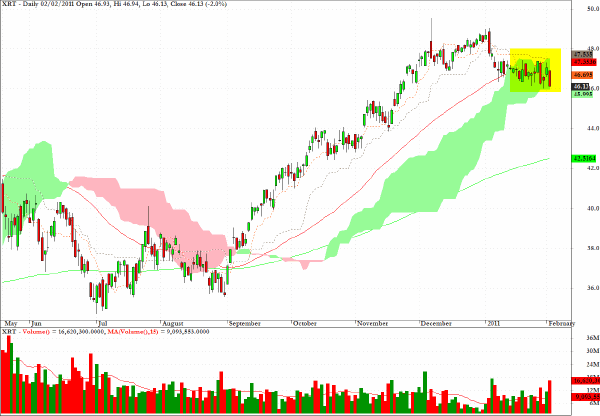
XRT, an ETF for the retail sector, shows some technical weakness following yesterday’s action. The close is below the 50-day EMA and has now entered the cloud formation after a rather extraordinarily bullish run since the beginning of last September, which echoes that seen on most US equity ETF’s.
This sector fund has now dropped below the cloud formation, and while a bounce back would not be surprising to see, the focus should again be on the quality of the rally effort, especially the volume characteristics.
Clive Corcoran is the publisher of TradeWithForm.com, which provides daily analysis and commentary on the US stock market.
|