| Corcoran Technical Trading Patterns For February 7 |
| By Clive Corcoran |
Published
02/7/2011
|
Currency , Stocks
|
Unrated
|
|
|
|
Corcoran Technical Trading Patterns For February 7
In Friday’s commentary I discussed the likelihood that yields on long dated UST’s appeared ready to break out, and specifically that the yield on the 10-year note looked ready for a close above 3.6%. After the somewhat ambiguous report from the BLS regarding January employment data the perception, now gaining more followers, is that the US economy is now recovering at a steady, if unspectacular, rate. But what also appears to be gaining traction is the notion that the modest recovery may be impacted by the rising inflation pressures which are already manifesting themselves in many Asian economies.
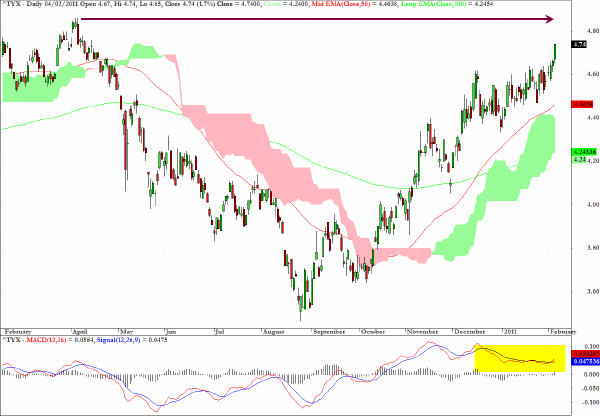
The 10-year note closed Friday’ session at 3.65% and the 30-year yield, as seen on the daily chart below closed in a potential breakout mode at 4.74%. As can be seen from the chart, the arrow extended across from the April 2010 high at 4.85% now seems to be the next target, but in reviewing the MACD chart one could sense that the momentum upwards will need to pick up if the rally in yields (or selloff in bond prices) is to be sustained in the near term.
Also worth consideration is the following comment which I made at the Seeking Alpha site in connection with a writer who was also commenting that US Treasury yields look to be headed quite a bit higher.
With debt/GDP levels at record levels in many countries, one wonders how secure that recovery is when coupons that will be attached to new issues on new 10-year notes may well be 4-5% in the next few months. Perhaps a lot more if the BRIC inflation malaise gets properly reflected in US CPI data.
I am inclined to be less cheerful about these signs of economic recovery when we are on the verge of a doubling of US government debt service costs, compared to where yields have typically been over the last 2 years.
This is further aggravated by the fact that so much of that debt is held externally, and the fact that corporate bond rates will, in turn, be moving higher as will ARM’s (etc) .
The real test for UST’s will be when the Fed is no longer the buyer of last resort.

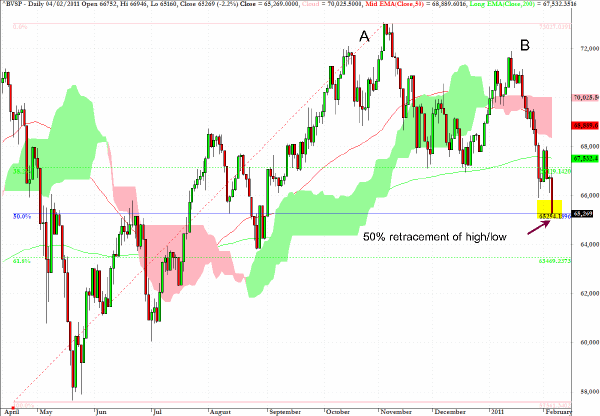
The usefulness of fibonacci retracement targets in forecasting potential price targets and support/resistance levels is well illustrated in relation to the weekly close for Brazil’s Bovespa Index. On February 4 the index closed at 65,269 which was almost exactly the level indicated in the broadcast slot which I did for Thomson Reuters last week and which also echoes my target in the daily commentary which was published early on February 3.

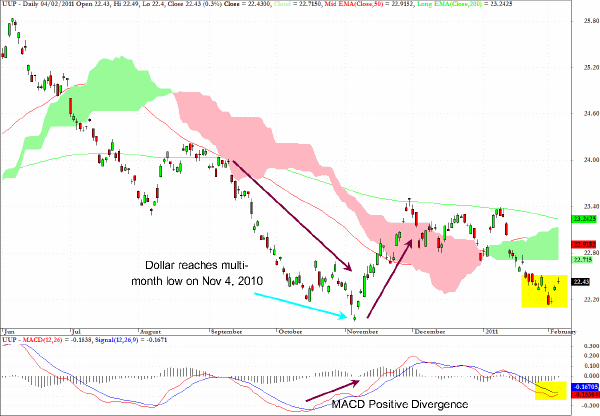
I'll be paying particular attention this week to the US dollar against a broad basket of other currencies, and the ETF which best captures this is UUP.
The following comments come from an article which was published here and which discusses, among other things, the co-movement of the US dollar and the appetite for BRIC equities.
The following point was made:
Evident on the chart is the low seen in early November which was also accompanied by a positive technical divergence in momentum. One could argue that the last move down in early November was the final thrust by FX traders keen to set up better levels for taking long positions on all of the key dollar cross rates as the implications of further QE became the focal point in markets. Adding to the notable bounce in the dollar was also the fact that Chairman Bernanke limited himself to only $600 billion, rather than the $1 trillion or more which some had been projecting.
Essentially the technical pattern suggests that the dollar is trying to form a base near current levels. However, as I point out in the article, from a fundamental point of view, the BRIC markets have been correcting for some time and have reached quite critical levels. From a macro perspective a lot will depend on whether asset allocators can put aside their concerns about troublesome inflation now evident in the BRIC’s and EM markets, and take the setbacks in equity prices in India, Brazil and China as buying opportunities to increase exposure to this sector, or whether they will continue to re-allocate into the US market. If it is the latter this would conform with the view that the US dollar could move considerably higher in months to come, and I am becoming more inclined towards that view.

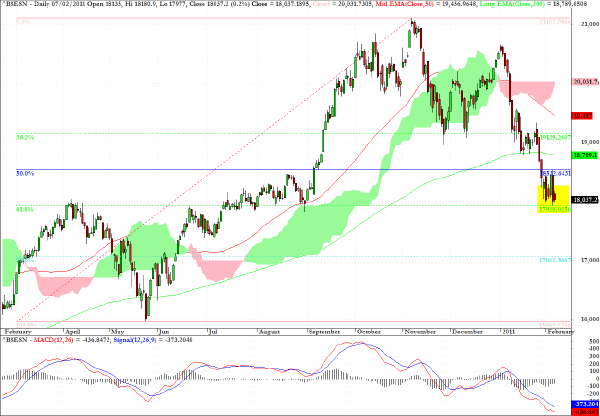
The Mumbai Sensex registered a tiny inside day pattern in Asian trading on Monday and closed just above the pivotal 18,000 level. The technical pattern favors a near-term bounce, but the quality of the rally will be vital to monitor as it directly plays into the alternative scenarios discussed in connection with the medium-term direction of the US dollar and UUP (see above).

Clive Corcoran is the publisher of TradeWithForm.com, which provides daily analysis and commentary on the US stock market.
|