| Corcoran Technical Trading Patterns For February 10 |
| By Clive Corcoran |
Published
02/10/2011
|
Stocks , Currency
|
Unrated
|
|
|
|
Corcoran Technical Trading Patterns For February 10
Today’s commentary is primarily concerned with pointing to some rather easily discernible negative divergences which are becoming apparent as equity markets in the advanced economies continue to move upwards.
This is in contrast to the ongoing attrition in many EM sectors which I also will cover below and where the predominant technical characteristic, which I have been alluding to for some time, is that distribution has been taking place on some key indices/geographical sectors since last November.
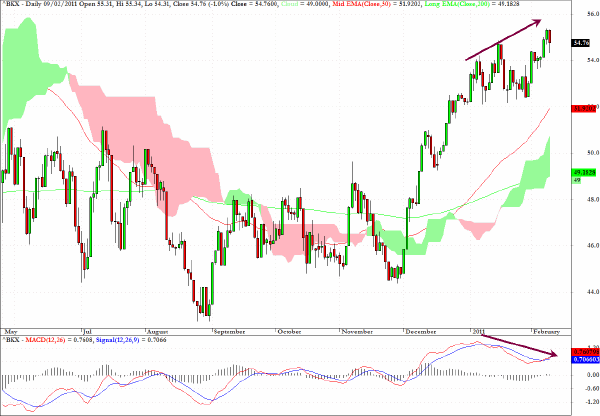
The KBW Banking Index clearly reveals a negative divergence between the price action and the momentum as expressed on the MACD chart. While I am not trying to point to any kind of obvious topping process - negative divergences can persist for a long time - it is advisable to be aware that the easy money on the rally in US equities has already been made.
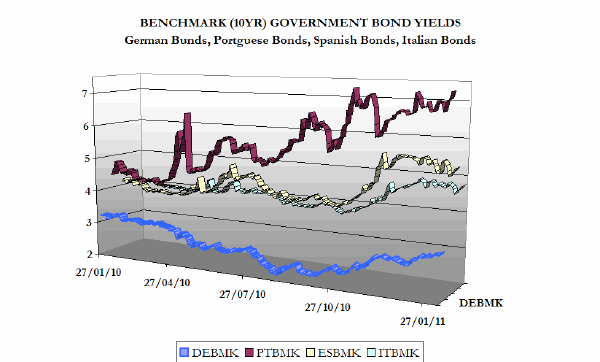
The three-dimensional chart below, which I'll be discussing on CNBC’s European Closing Bell this afternoon, shows the trajectories of yields on four key European government bonds.
At the time of writing the yield on the Portuguese 10-yr government bond has broken out to a new high but, interestingly, because of the upward path of German bund yields as well, the spread between Portuguese and German bonds is not as wide as it was during the Ireland crisis late last year.
Bund yields are also at a 52-week high.
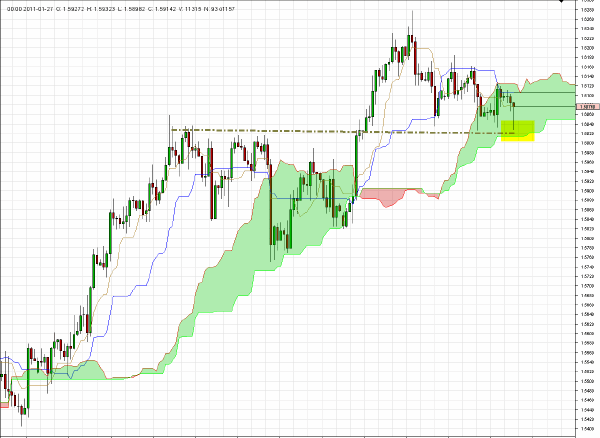
Just while finishing today’s newsletter the Bank of England has decided to keep the UK repo rate at 0.5% and this has caused gyrations in GBP/USD. The chart which was captured before the decision illustrates that if $1.6020 is taken out there is plenty of scope for downside action.
However, I would be cautious trading sterling today as there may well be a counter intuitive move upwards on the notion that the markets had already discounted the fact that the Bank would leave rates unchanged. Indeed a buy stop at $1.6180 with a 100 pip target gain could be worth considering for aggressive FX day traders.
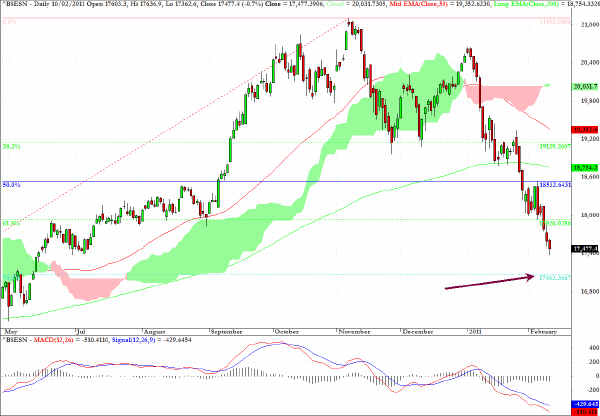
The Mumbai Sensex registered another losing session following its drop below the critical 18,000 level.
The suspicion is that index should soon find some support but it may need to test the 17,000 level which also coincides with the 62% retracement of the high/lows evident on the chart.
Here are my comments from the Daily Form commentary from February 3.
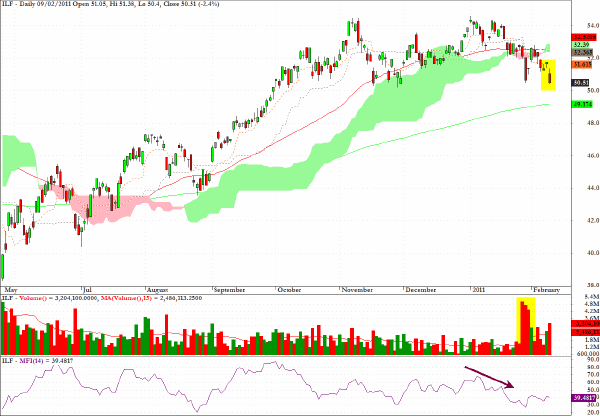
ILF is an exchange traded fund which tracks major Latin American equities, and the heavy red volume bars which have been highlighted raise the specter that there could be further weakness ahead for Latin American markets.
The MFI chart segment at the bottom of the chart reveals negative divergences which help to underline the technical weakness of this sector fund.
Here are my comments from the Daily Form column from January 31.
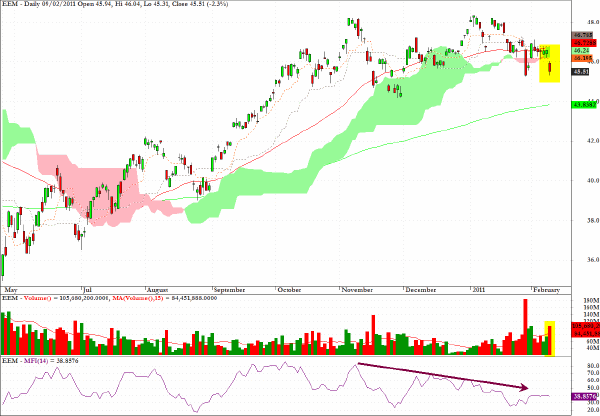
EEM has broken an uptrend line and a feasible target in coming sessions would be a test of the 200-day EMA.
Notable once again is the negative slope in the MFI chart indicating that distribution has been taking place over the last three months.
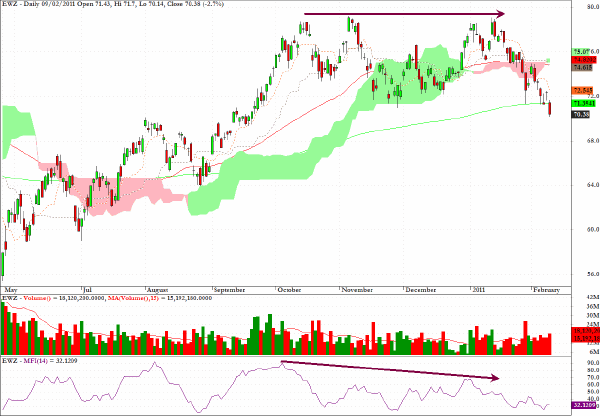
EWZ broke below the 200-day EMA and yet again there is evidence of distribution since November.
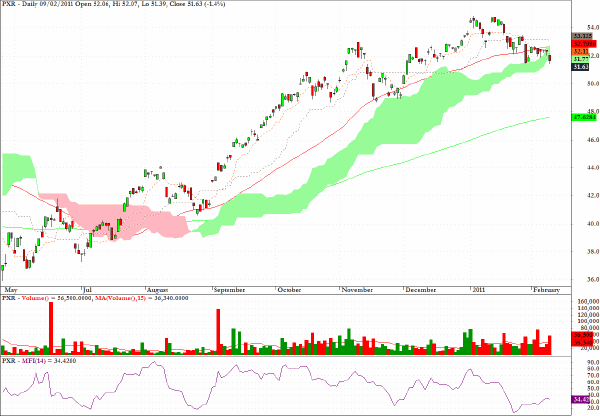
Underscoring the general theme of today’s letter that the emerging markets are experiencing attrition across the board, and distribution characteristics are clearly evident, is the weak chart for PXR, which is a rather lightly traded sector fund called Power Shares Emerging Markets Infrastructure.
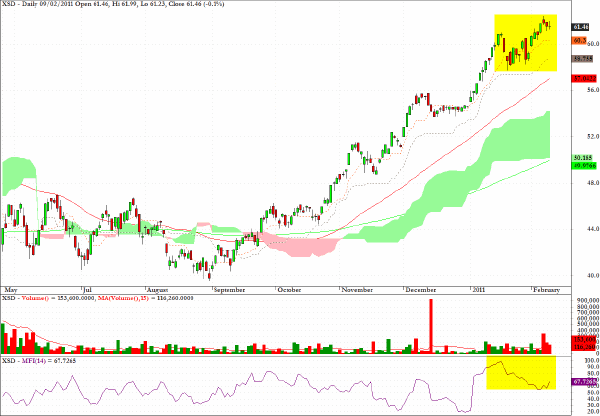
The chart for XSD, an ETF for semiconductor stocks, is revealing some notable negative MFI divergences, despite making new highs.
Clive Corcoran is the publisher of TradeWithForm.com, which provides daily analysis and commentary on the US stock market.
|