| Corcoran Technical Trading Patterns For February 17 |
| By Clive Corcoran |
Published
02/17/2011
|
Stocks , Currency
|
Unrated
|
|
|
|
Corcoran Technical Trading Patterns For February 17
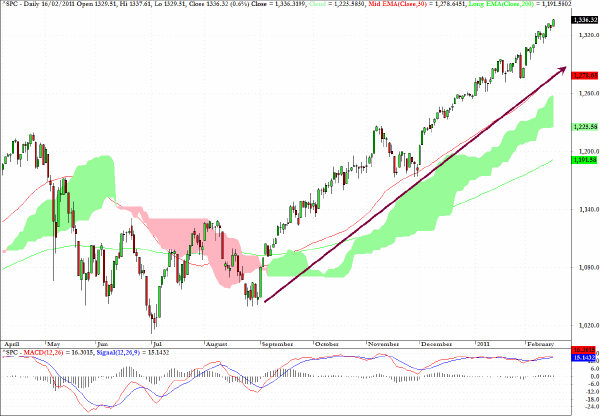
Some regular readers of the Daily Form commentary have asked me recently why I have not featured any analysis of the S&P 500. As the benchmark index for US equities it may seem remiss not to have covered it for some time.
The only thing that I would say about the index, and it is graphically illustrated in the chart below, is that it has gone up almost without interruption since last September. The rate of ascent and the lack of any meaningful correction seems, to my mode of interpretation, to be quite extraordinary.
Furthermore it really underscores the notion of how valuable it has been - to paraphrase the song title - to get a little (actually a lot of) help from your friends, i.e., the Fed.
Undoubtedly the almost daily POMO operations have helped, and there seems to be a mood of benign complacency now on the part of asset allocators that the US fundamentals are just right - not too fast a recovery, not too much inflation and a generally positive outlook for US domiciled multi-nationals.
If the trend is your friend why would you want to go against such an obvious uptrend and especially if that would mean violating the other alleged golden rule of investing in the US -- i.e. don’t fight the Fed.
Perhaps it is as easy as that!

Because there is really little to say about the US equity market other than was said above, I have found myself recently focusing more on the BRIC’s and the EM markets.
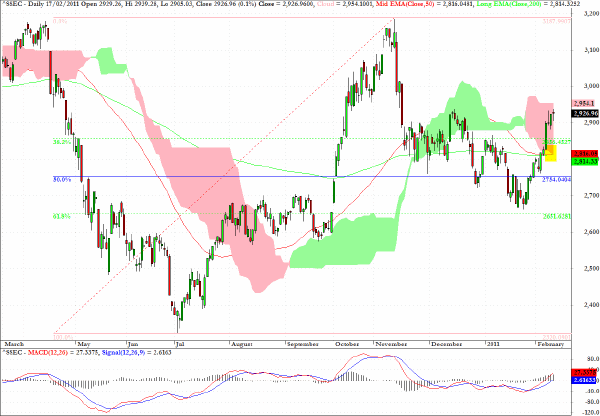
The Shanghai exchange barely budged in Asian trading on Thursday and registered a tiny hanging man formation near to the top of the pink cloud formation.
I am still expecting an eventual retest of the top of the range indicated on the fibonacci grid at around 3200, and I believe that it will be of considerable consequence to macro asset allocation decisions in the intermediate term, to see whether or not the resistance at this level can be overcome.

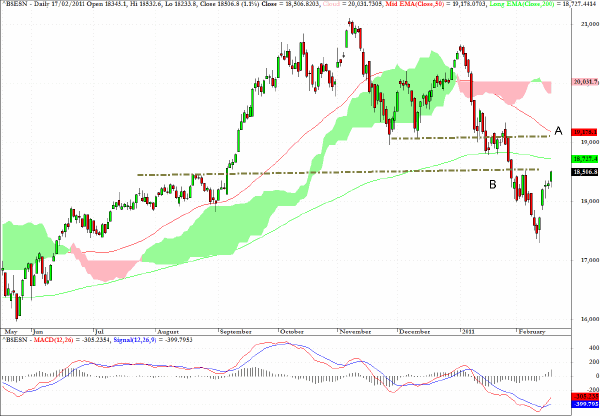
Turning to one of the other key BRIC markets, the Mumbai exchange has continued its recovery and I anticipate that there are three potential resistance levels that will need to be tackled in coming sessions.
The first is indicated by the dotted line B, then above that is the 200-day EMA at around 18,700 and if that can be overcome there is further resistance at the level marked by dotted line A which also coincides with the 50-day EMA at around 19,150.
Of some concern on the daily chart below is the fact that both the 50-day EMA and the 200-day EMA are slanting downwards reflecting the weak performance for several weeks. The MACD basing pattern suggests that further rally efforts are to be expected but, given the barriers to overcome as discussed in the previous paragraph, there will be a need for a series of sustained momentum moves upwards to re-establish a more bullish tone for this index.

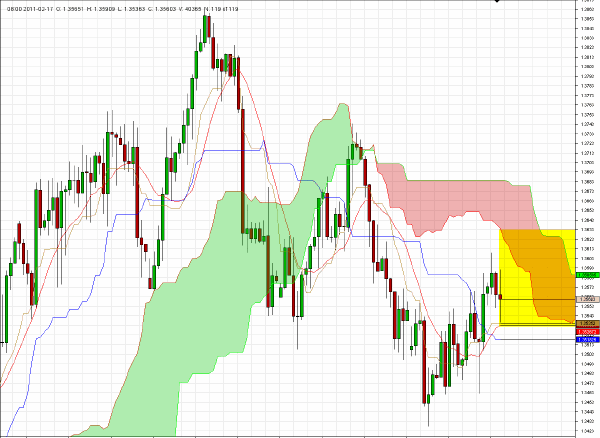
One of the benefits of Ichimoku analysis is the fact that it enables one to anticipate possible price developments into the future based upon the cloud formation projections into the future, which result from the methodology of construction.
As can be seen on the 240-minute chart for EUR/USD below, the area highlighted in yellow suggests that the euro will encounter a falling boundary to the projected cloud formation, and I would expect this to provide resistance to price gains. It would take a clear break above the top side of the cloud formation to turn me into a euro bull at this stage, so my preferred stance is to look to sell sharp rallies and be looking for about 50/60 pips of gain on each trade, with a maximum risk of 30 pips.

Clive Corcoran is the publisher of TradeWithForm.com, which provides daily analysis and commentary on the US stock market.
|