| Corcoran Technical Trading Patterns For February 18 |
| By Clive Corcoran |
Published
02/18/2011
|
Currency , Stocks
|
Unrated
|
|
|
|
Corcoran Technical Trading Patterns For February 18
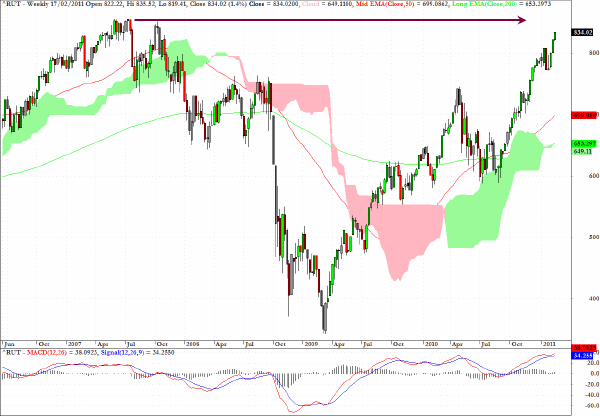
Yesterday I showed the remarkable ascent of the S&P 500 since early September 2010 but its performance has been eclipsed by that of the Russell 2000 index of micro-cap stocks.
The long-term weekly chart shows that the index closed yesterday just slightly more than 20 points below its all time highest close of 855.77 - achieved on July 13, 2007. At the current rate of progress of the high beta stocks this could be challenged as soon as next week.
IWM, which is the exchange traded proxy for this index, is making headway on subpar volume and, as is typical of several charts, the high volume days in the recent past have tended to be the ones where the index closed down. The MFI divergence is not disturbingly negative and, as I have indicated here recently, from the point of view of short-term tactical trading, negative divergences can persist for extended periods.
The ride up to the old top seems to be just a matter of time and then we shall have to see whether it can just keep on going or pause for refreshments.

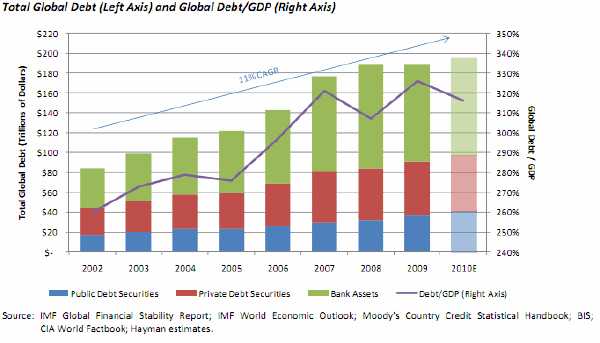
The second chart for today is somewhat unusual but also highly illuminating and comes from the Hayman Capital Management Letter to Investors for February 2011.
Kyle Bass, who runs the fund, recently made some very interesting comments in a CNBC interview about what he sees as the coming sovereign debt debacle and cited several reasons why he believes that a sovereign domino effect would be the ultimate systemic crisis.
The chart has many aspects but clearly visible is the 11% compounded annual growth rate of total debt outstanding since 2002. The total now stands at $200 trillion. The right hand scale shows the global debt/GDP ratio which is projected for 2010 at almost 320%.
One of the more interesting comments that is made in the very worthwhile report is that Bass is of the view that a better measure for assessing the seriousness of the issue is the debt/government revenue ratios. GDP statistics contain a multitude of economic data which may or may not be relevant to the likelihood that a sovereign is creditworthy. If the ratio, on a single sovereign basis, is to express the total debt as a percentage of the total government revenue the ratio provides a better guide to the likelihood that the debt can be serviced properly. Needless to say, the ratios for US, UK and Japan are quite extraordinarily high, raising the specter of what Bass calls the Keynesian end point - which is where there is insufficient government revenue to even service the debt load!
To quote just one statistic from the letter:
...a move back to 5% short rates will increase annual US interest expense by almost $700 billion annually against current US government revenues of $2.228 trillion (CBO FY 2011 forecast).

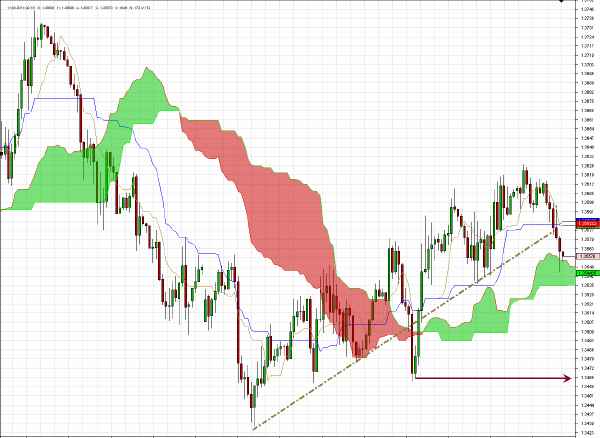
EUR/USD has been selling off in European trading on Friday, partly in response to the announcement of further PBOC tightening - which was not entirely unexpected.
Technically the break of the dotted trend-line on the 60-minute chart below suggests that the drop down to $1.3450 in recent sessions needs to be retested.

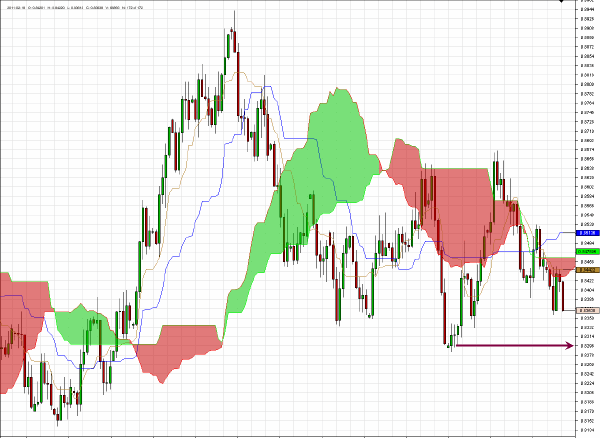
Based on both technical evidence and also on the fundamentals which are driving sterling higher i.e. the open dissent on the MPC regarding the need for interest rate hikes to address inflation, selling EUR/GBP would be a recommended longer-term play - with an initial target on the daily chart as indicated at 0.8280 with a possible retest of the 0.8150 further out on the horizon.

Clive Corcoran is the publisher of TradeWithForm.com, which provides daily analysis and commentary on the US stock market.
|