| Corcoran Technical Trading Patterns For February 22 |
| By Clive Corcoran |
Published
02/22/2011
|
Currency , Stocks
|
Unrated
|
|
|
|
Corcoran Technical Trading Patterns For February 22
The gravity of the unrest in Libya is starting to dampen the animal spirits and the fact that Brent crude touched $108 in early European trading acts as a nasty reminder that just one of the risks that asset allocators need to focus on is that large jumps in crude prices will only add more fuel to smoldering inflationary cinders (please excuse the pun).
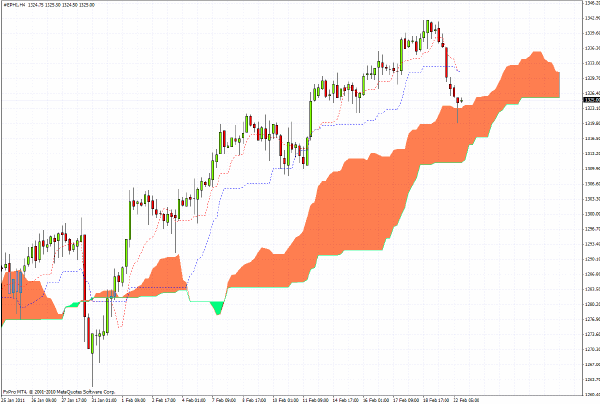
The 240-minute chart for the S&P 500 futures shows that the index has dropped down to the top of the cloud formation, and this appears to be providing some support during the European session. However, traders are largely on hold and are waiting to see how the US markets will react after the public holiday yesterday.
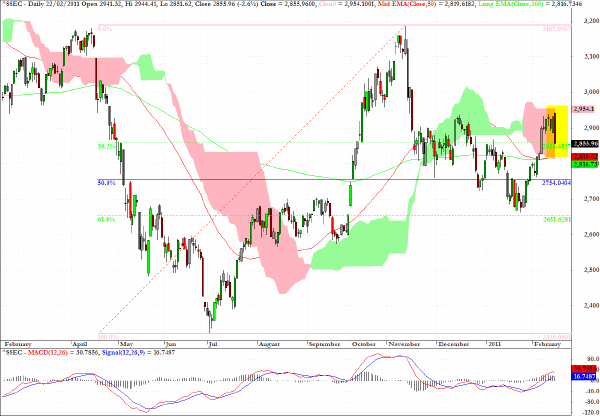
The Shanghai index registered a rather nasty red trend day candlestick in Asian trading Tuesday with a loss of 2.6%.
As discussed here recently, the index is struggling with a lack of momentum which is inhibiting it from making decisive progress through the cloud formation.
The 50 and 200-day EMA’s still remain at an intersection point with a bias toward the faster EMA crossing the longer from above.
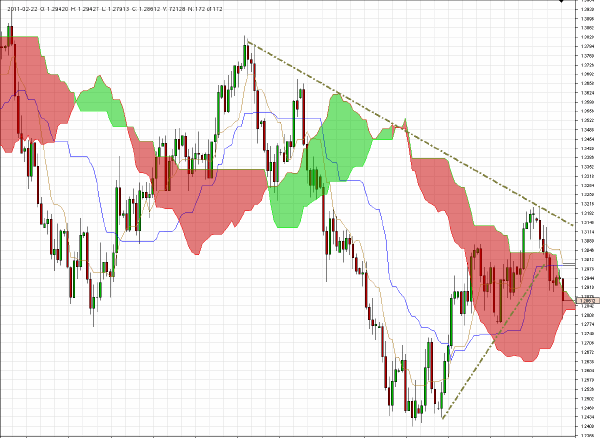
I have suggested in this column, not so long ago, that for position traders the EUR/CHF pair would be likely to exhibit a downward bias and that rallies were good opportunities to add to short positions.
In the near term the 1.27 region should provide some support but if that eventually fails, as I am inclined to believe it will once traders have fully discounted the hawkish rhetoric coming from some ECB officials, a break below 1.27 would expose the lows around 1.24 again as a probable target for testing.
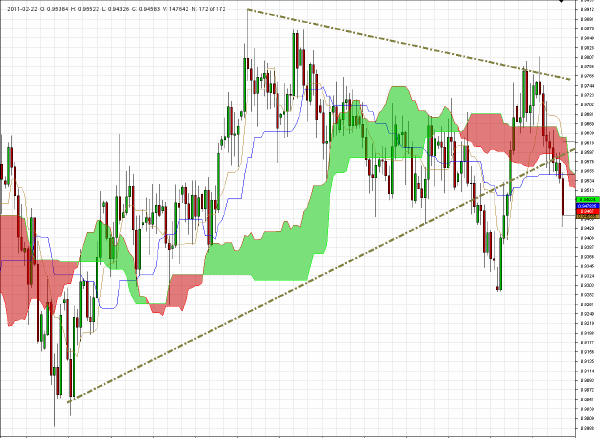
The key AUD crosses - AUD/JPY and AUD/CHF - are both signaling a rather pronounced risk-off macro environment for trading today.
In particular I am focusing on AUD/CHF which appears, in the intermediate term, ready to test the 0.93 level.
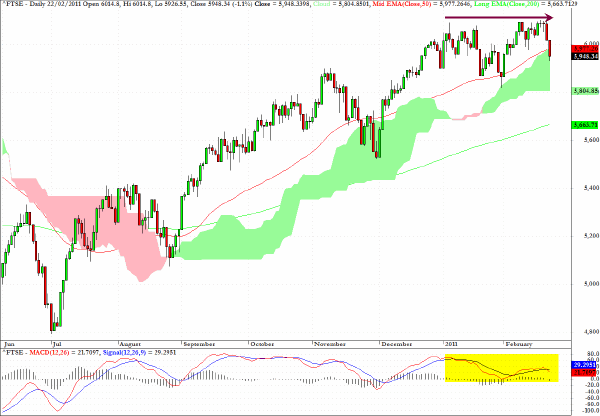
The FTSE index has seen two days of selling and is currently below its 50-day EMA and on the verge of dropping below the uptrend line through the lows from last July.
An eventual retest of the 5800 level at the bottom of the cloud seems to be a reasonably probable scenario.
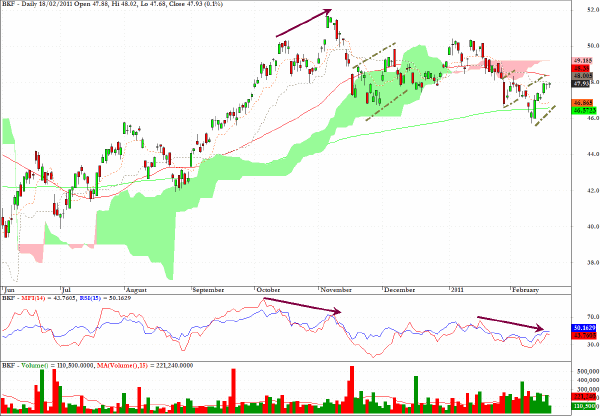
BKF, one of the main sector funds which track the BRIC economies, and which did not trade yesterday due to the public holiday in the US, looks set for further corrective behavior.
The notable negative price/MFI divergences, which have been annotated on the chart, provide additional concern that the allocation back into EM/BRIC may not be proceeding according to schedule for some asset managers that were trumpeting the imminent likelihood of this rotation play.
Clive Corcoran is the publisher of TradeWithForm.com, which provides daily analysis and commentary on the US stock market.
|