| The McMillan Options Strategist Weekly |
| By Lawrence G. McMillan |
Published
02/25/2011
|
Options
|
Unrated
|
|
|
|
The McMillan Options Strategist Weekly
The market finally broke down this week, using the excuse of unrest in Libya, accompanied by sharply higher oil prices.
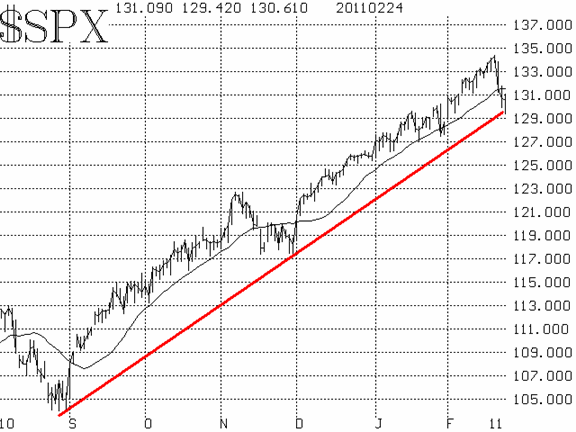
Accordingly, $SPX fell about 50 points to the level of the bull market trend line -- the line connecting the August and November lows. A close below today's lows would signal a more bearish scenario is about to unfold.

The most bullish intermediate-term indicator continues to be the price chart of $SPX. It is still bullish as long as that trend line remains intact.

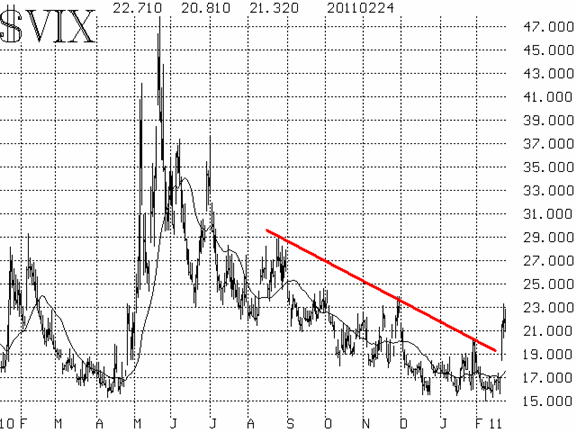
Contrast this with the $VIX chart (figure 4). $VIX rose sharply this week, breaking through its trend line. As a result, the $VIX chart is now in an uptrend and that is bearish for stocks. As long as $VIX remains above 20, it will remain a negative factor for stocks.

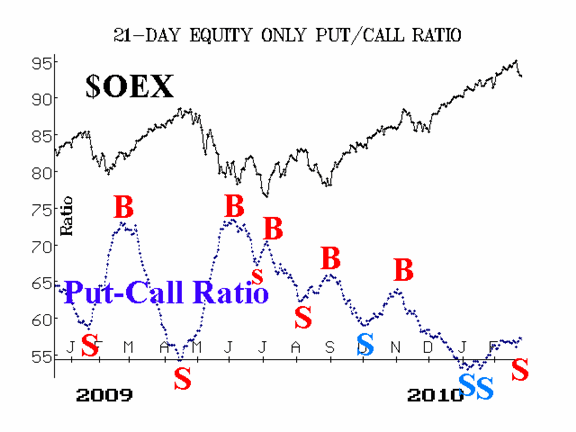
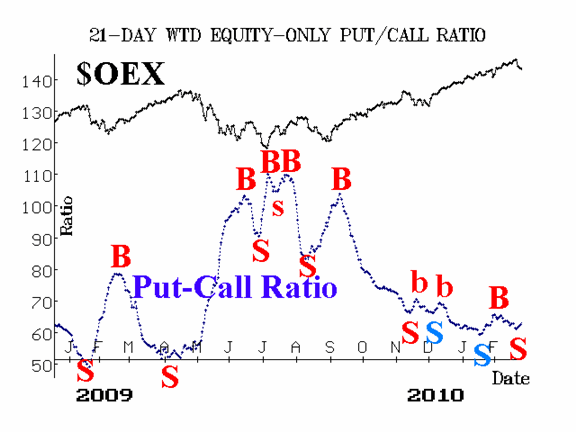
Market breadth has been weak, and the breadth oscillators have descended into sell signals.

In summary, the intermediate-term indicators are mixed. A breakdown by $SPX below 1294 will turn the intermediate-term picture bearish, while a $VIX close below 20 will make the intermediate-term picture bullish.
Lawrence G. McMillan is the author of two best selling books on options, including Options as a Strategic Investment, recognized as essential resources for any serious option trader's library.
|