| Corcoran Technical Trading Patterns For February 28 |
| By Clive Corcoran |
Published
02/28/2011
|
Stocks , Currency
|
Unrated
|
|
|
|
Corcoran Technical Trading Patterns For February 28
Due to other commitments, commentaries this week may be sporadic and shorter than normal.
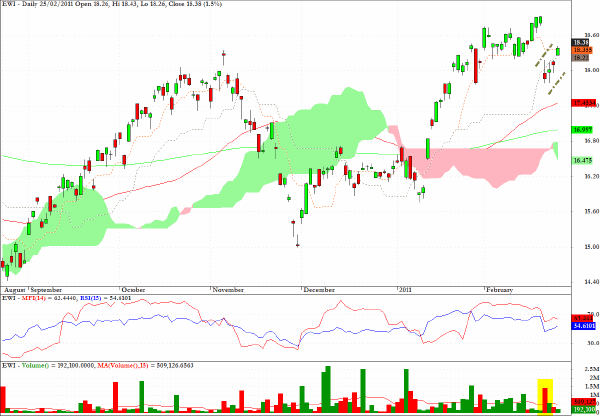
The daily chart for the exchange traded fund, EWI, which tracks the MSCI Italy Index, is displaying a clear example of a bearish flag pullback and would seem to be vulnerable to further selling.
I would also like to mention that I'll be a keynote speaker at the Traders Expo to be held in London on April 8/9.

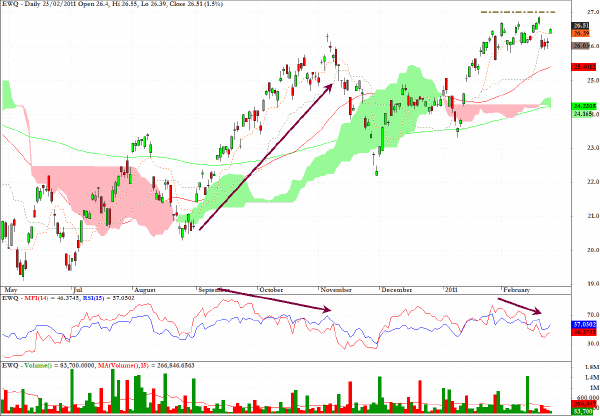
EWQ, which tracks the MSCI France index is also displaying negative divergences and as illustrated on the chart there was a notable nonconfirmation from the MFI segment of the rising price pattern during last October which culminated in a sizable selloff.
The current pattern shows more of a price plateau with distribution characteristics, but I would suspect that the overhead resistance shown during February may prove to be a barrier to further progress in the medium term.

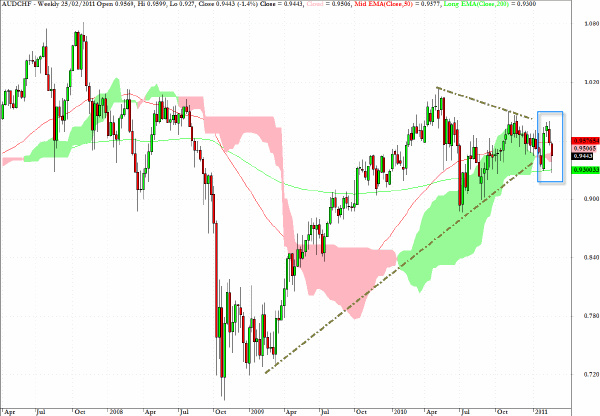
AUD/CHF has been one of my favorite shorts over the last two weeks and the weekly chart pattern reveals an interesting formation which is that the range covered by the last two candlesticks i.e. for the last two weeks, exceeded the range of the prior two weeks taken together. This would represent a two-week outside formation.
The flight to safety into the Swiss franc has been one of the more notable FX developments during the troubled times in North Africa and the Middle East, and the current level for the Aussie is fairly critically poised at the apex of a triangle with a risk more likely to the downside than the upside in my estimation.

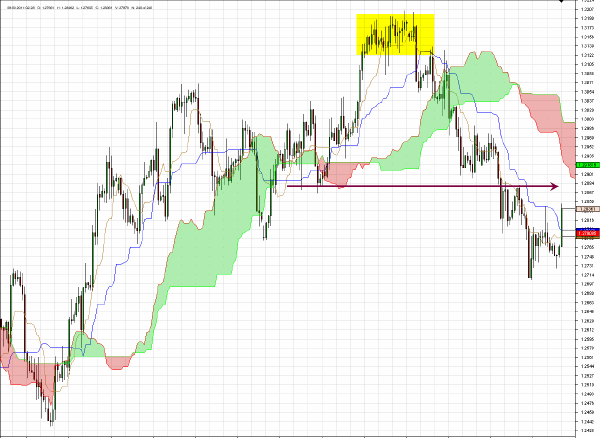
One further cross rate which has been attractive to trade recently has been EUR/CHF.
The current outlook from the 240-minute chart below suggests that in the near term the long side would seem to be, on balance, more appealing but the level indicated by the arrow at 1.29 - also where the projected cloud formation is located and should act as resistance - is the recommended zone to be looking at short entry opportunities again.

Clive Corcoran is the publisher of TradeWithForm.com, which provides daily analysis and commentary on the US stock market.
|