| Corcoran Technical Trading Patterns For March 2 |
| By Clive Corcoran |
Published
03/2/2011
|
Stocks , Currency
|
Unrated
|
|
|
|
Corcoran Technical Trading Patterns For March 2
Yesterday was decidedly not a good day for the animal spirits as most risk assets spent the day spiraling downwards.
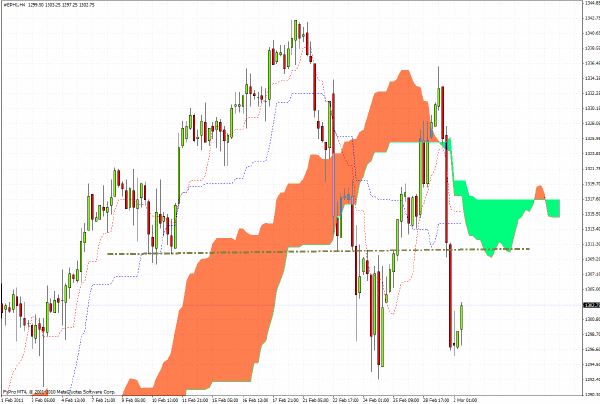
Seen below is the 240-minute chart for the eMini S&P 500 futures which provides a very clear illustration of yesterday’s (and other recent) plunges, and also the chart indicates a clear barrier which will need to be overcome in today’s session at the 1310 level.
I spent some time yesterday watching the testimony of Ben Bernanke before the Senate Banking committee. He made some rather remarkable comments in response to what, from time to time, were some very good questions put to him by members of the committee. One of my favorites was when he stated that he did not think it would be a good idea for the US to default on its debts when he was asked about the consequences of not raising the debt ceiling...that was rather reassuring!
The central theme of his remarks, and he came back to the point several times, was that the efficacy of QE2 should be judged primarily on its demonstrated ability to lift equities and thus avoid asset deflation. Given that the S&P 500 has doubled in the last two years he would seem to have been vindicated. However, as a by-product of QE and ZIRP, it also needs to be underlined that the US dollar is particularly weak at present in a global economy where many nations are suffering from rising inflation.
In the fullness of time it may become apparent that he has been following an imprudent course, as the belief that the US will somehow stay immune from this risk may turn out to have been a highly significant misjudgment.
Also noteworthy was his firm reassurance that he has not been monetizing the debt of the US when the Fed keeps taking hundreds of billions of US Treasuries onto its balance sheet, because it is his long-term plan to sterilize this accommodation by eventually selling these notes back to the private sector...let’s hope that this "exit procedure" will work out as smoothly as he seemed to be suggesting.
I would also like to mention that I shall be a keynote speaker at the Traders Expo to be held in London on April 8/9.
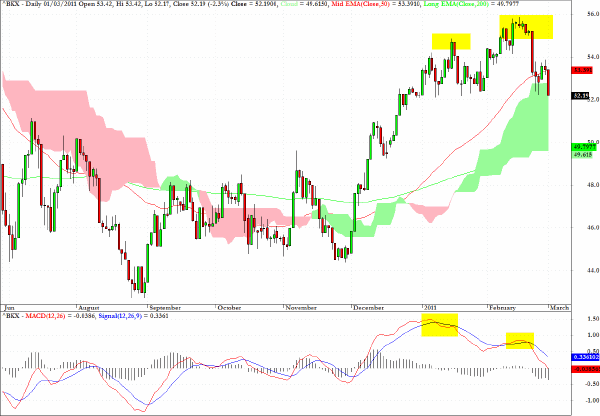
In many previous commentaries I have made the point that divergences between upward sloping price development and downward sloping momentum (MACD) or money flow are a harbinger that corrective action lies ahead. I have also pointed out that such divergences can continue for some time, and accordingly I do not use them as reliable short-term signals. However, in the intermediate term (four weeks) once a warning signal has been registered there is a definite tilting of the risk/reward matrix in favor of the short side.
The chart below shows that despite a lot of positive price moves over the last few weeks for the KBW Banking Index, there was non-confirmation/negative divergence arising in the momentum indicators. Also revealing was the fact that both KBE and XLF, ETF’s which track the banking index and the US financial sector more generally, have been indicating distribution via negative MFI divergences throughout most of the last 60 trading sessions.
The intermediate-term target for BKX would be $50 and for KBE, the ETF which specifically tracks the Banking index, it would be around $24.75 which marks both the base of the cloud formation and the 200-day EMA.
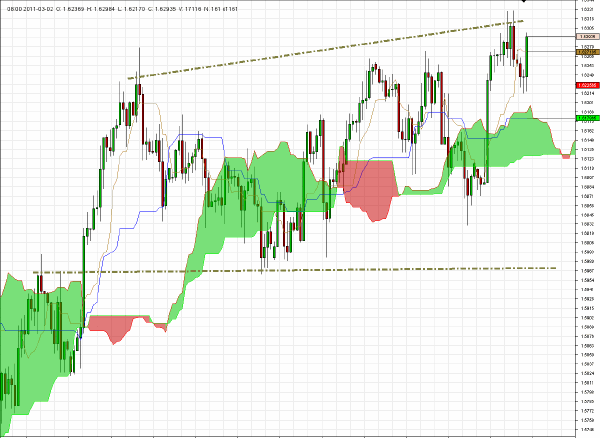
The 4-hour chart for GBP/USD reveals the breakout in late January which has kept sterling above the $1.60 level ever since. There should be strong resistance just above $.163 but there are some suggestions from the price pattern that the UK currency could be poised to break above the top of the recent range.
The driving factor behind this move is the gathering belief that the BOE’s Monetary Policy Committee (MPC) will have to address inflation concerns with higher rates - perhaps as early as the next meeting. But just to prove the adage about two-handed economists, the flip side of the coin of trying to prevent the importing of inflation by raising rates and thereby encouraging the strength of sterling, would also act as a dampener on the UK’s need to export more to raise revenue for the Treasury so that it can meet its ambitious goals of halving the deficit over the next four years.
In my estimation the anemic economy and poor public finances indicate that the UK still remains one of the most precariously balanced in western Europe - even though, as the world’s most loved onshore tax haven for foreigners, the price of real estate in the most fashionable parts of London continues to set new records.
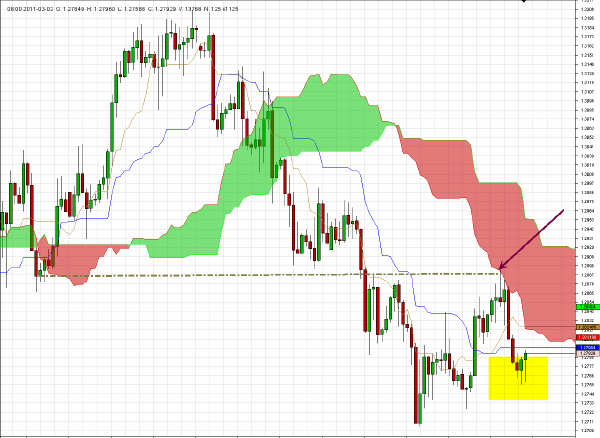
Here again are my comments from Monday’s column which proved to be almost exactly the way that price action unfolded over the last 48 hours.
The current outlook from the 240-minute chart below suggests that in the near term the long side would seem to be, on balance, more appealing but the level indicated by the arrow at 1.29 - also where the projected cloud formation is located and should act as resistance - is the recommended zone to be looking at short entry opportunities again.
I took more than 100 pips profit early this morning during the European session and will now wait for another opportunity to build a new short position as the rate heads back towards 1.2850.
Here again are comments from the February 10 newsletter.
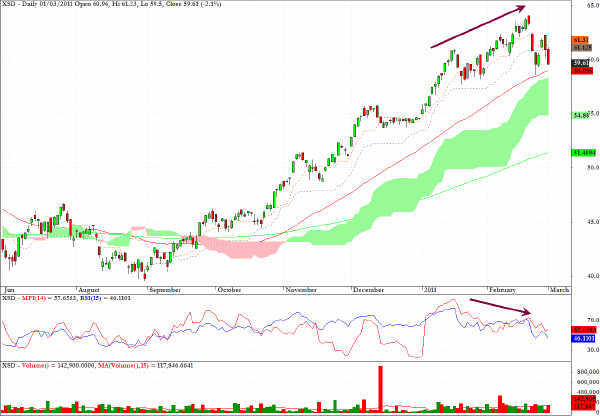
The chart for XSD, an ETF for semiconductor stocks, is revealing some notable negative MFI divergences, despite making new highs.
The intermediat-term target - but wait for a rebound before entering - would be around $55.
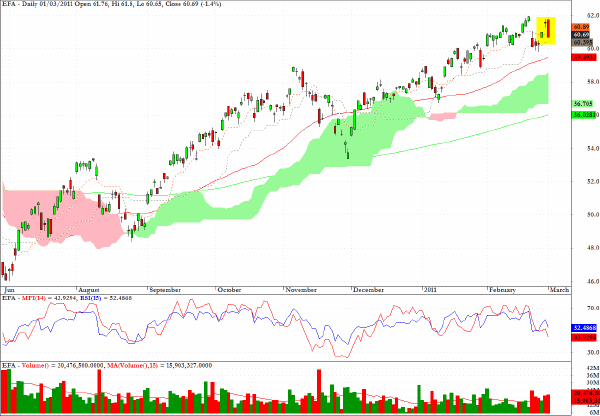
The sector fund, EFA, which tracks the MSCI EAFE index, exhibits a good example of an evening star candlestick.
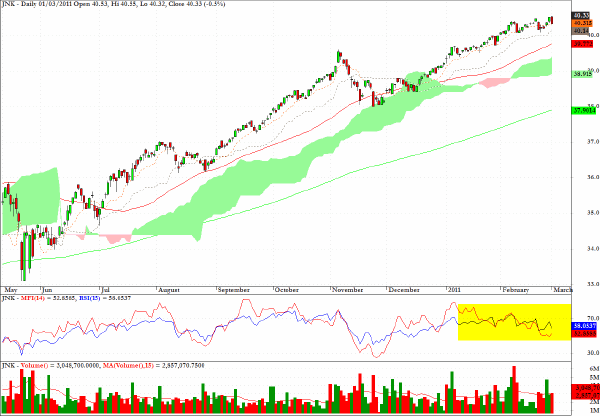
High yield bonds have remained a favored risk on asset class for most of the last two years but the chart below suggests that the dissonance and negative divergences are becoming ever more apparent.
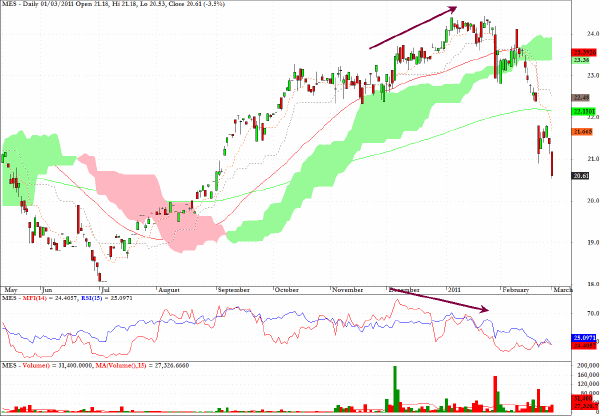
MES,an ETF providing exposure to the Gulf States region, continues to plunge and the news - such as there is - which is emerging from Saudi Arabia - where the market has dropped sharply in recent sessions - would suggest that there is further downside ahead.
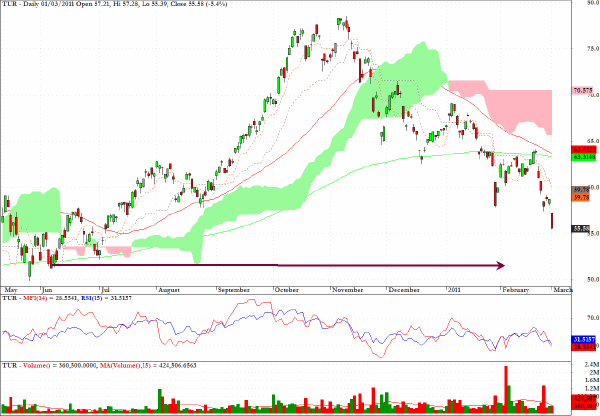
TUR, which tracks Turkish equities, was one of the worst performing ETF’s in yesterday’s session and may need to seek out lower levels as indicated by the arrow before real buying support emerges.
Clive Corcoran is the publisher of TradeWithForm.com, which provides daily analysis and commentary on the US stock market.
|