| Corcoran Technical Trading Patterns For March 3 |
| By Clive Corcoran |
Published
03/3/2011
|
Stocks , Currency
|
Unrated
|
|
|
|
Corcoran Technical Trading Patterns For March 3
During trading this morning in Europe there has been a definite waiting game surrounding the decision by the ECB on the short-term rates for the Eurozone. At the time of writing the ECB has just announced that it is leaving its key rate unchanged at 1%. Several of a more bullish persuasion regarding the euro were hoping that Mr. Trichet might have been sufficiently spooked by inflation to nudge the rate higher...but the immediate reaction has been rather muted ...however, the real test may come tomorrow after the release of the NFP data in the US.
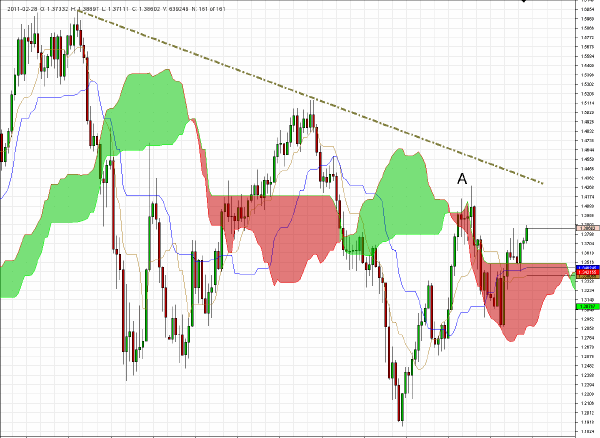
The chart below presents a weekly view of EUR/USD going back to the beginning of 2008.
The very simple suggestion that I would make on this chart is that point A failed to reach back to the dotted trend line, and that any further upward moves by the euro - perhaps following rate hikes down the road - would have to at least challenge level A on the chart for this to validate a more fundamentally bullish course for the EZ currency.

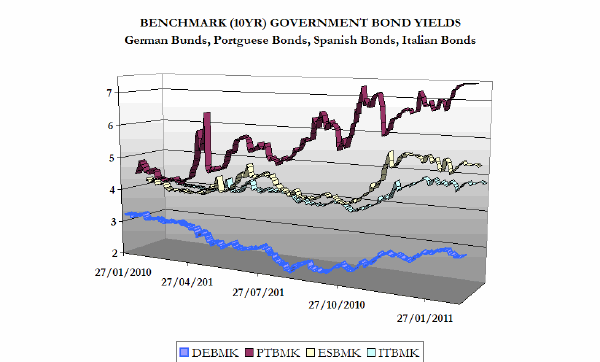
Yields on four key EZ government benchmark bonds have shown little retracement during the most recent turmoil in North Africa and the Middle East.
The yield on the Portuguese 10-year is still hovering around its historic high around 7.5%, and with a series of key meetings in coming weeks among EU leaders, and a hardening of attitudes by Angela Merkel, my suspicion is that there will be renewed focus on the need for a bailout for Portugal...which in turn will focus attention on the legal framework of the EFSF - a subject on which I have made my concerns clear several times before.
I also intend to touch on this topic in a slot on CNBC’s European Closing Bell this afternoon at 16:30 GMT (assuming that I don’t get bumped by some new geo-political "crisis").

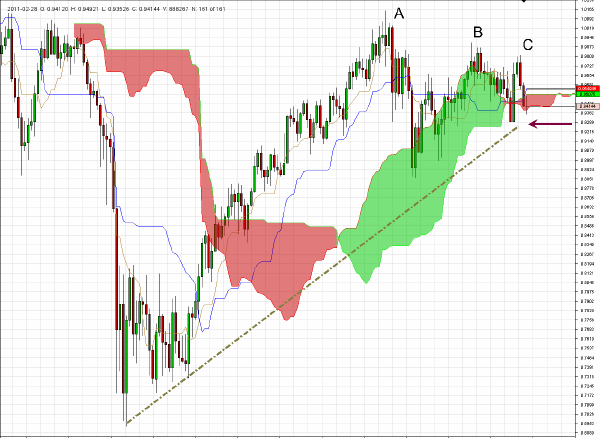
The weekly chart for AUD/CHF is becoming my preferred barometer -at least for the time being - of the appetite for macro risk.
As suggested the recent slide of the Aussie, or perhaps better expressed as the strength of the Swiss franc as a safe haven play, has brought this rate to a fairly key level on the chart below.
I have indicated the series of lower highs, A, B and C on the chart and as revealed the current level is somewhat delicately poised at the base of the cloud formation.
I have marked on the chart the importance of the 0.93 level from both a cloud perspective and as the lows seen during the last few weeks. A weekly close below 0.9250 would be a macro risk negative and just might cause some consternation for the large constituency of Risk On fund managers.

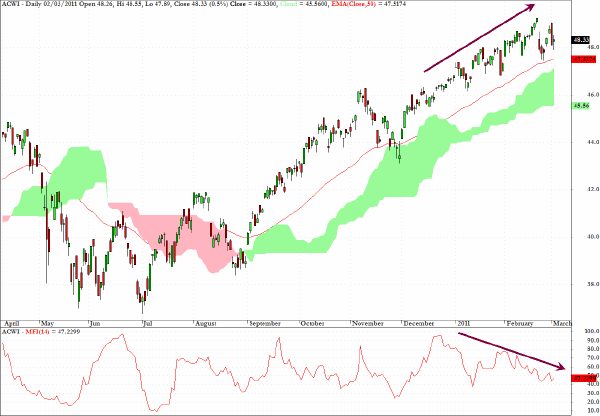
ACWI, the exchange traded proxy for the MSCI World Index, trades approximately half a million shares daily on the NYSE/Arca platform.
The current negative divergence between the price action over the last several weeks and the money flow is one of the most acute divergences of the major global sector indices that I track.

Clive Corcoran is the publisher of TradeWithForm.com, which provides daily analysis and commentary on the US stock market.
|