| Corcoran Technical Trading Patterns For March 14 |
| By Clive Corcoran |
Published
03/14/2011
|
Stocks , Currency
|
Unrated
|
|
|
|
Corcoran Technical Trading Patterns For March 14
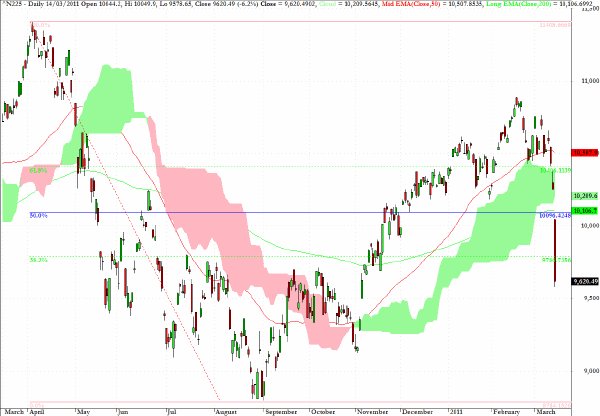
The Nikkei 225 closed down 6.2% and near to its low for Monday’s session. So much has been said regarding the human tragedy that it almost seems redundant to add to it.
Perhaps the most important acknowledgement is that the events of the last 72 hours reveal the fragility of systems created by human beings in the context of a planet which can, at times, unleash extremely powerful and destructive forces.
Seeking out protection against "tail" risk often resurfaces after a major tragedy but then as we move further away from the events - both man-made and natural - there is a tendency for many fund managers to revert to conducting risk management again using the naive assumptions of statistical probability based on the normal distribution. In general terms, so-called "tail" risk - not a term that is really meaningful as it relates back to the inappropriateness of quantifying the probability of extreme events on how many standard deviations one goes from the mean - remains significantly under priced in my estimation.

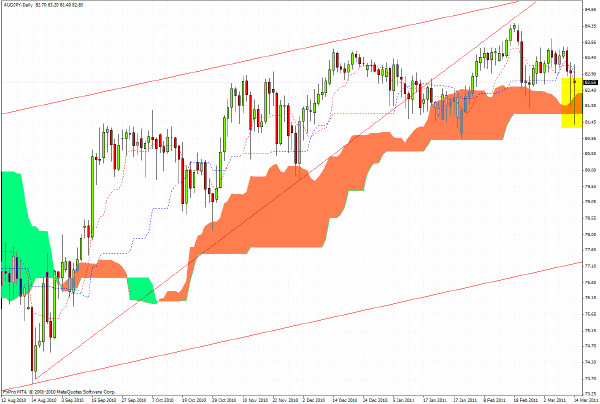
The large spike downwards on AUD/JPY to 81.45, as seen in earlier trading on the daily chart, violated the base of the long standing cloud formation.
The lines drawn illustrate that this FX pair, having failed at the 84.40 level to regain a foothold above the upward sloping trend line through the lows, is now at risk all of the way down to the 77 level.

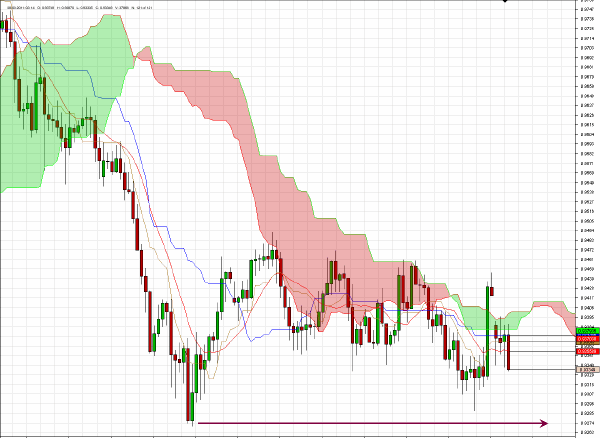
In a commentary last week I suggested that that the 0.9250 level was critical for AUD/CHF and a close below that level in Friday’s trading would have been an ominous development for risk appetite.
We managed to close quite comfortably above that level last Friday but, at the time of writing during European trading Monday morning, it is looking increasingly likely that the level illustrated by the long arrow is in need of testing.
Support - especially from central banks - may kick in at this level, but a clear breakdown below this critical level would underline the fact that market participants are now anticipating greater macro risks to many asset classes.

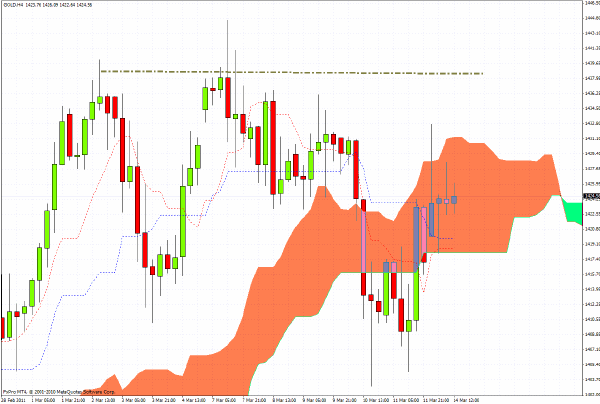
The 240-minute chart for spot gold continues to exhibit a fractal pattern which points to the potential of a significant breakout if the metal can move decisively above the dotted line on the chart at approximately the $1440 level.

Clive Corcoran is the publisher of TradeWithForm.com, which provides daily analysis and commentary on the US stock market.
|