| The McMillan Options Strategist Weekly |
| By Lawrence G. McMillan |
Published
03/25/2011
|
Stocks
|
Unrated
|
|
|
|
The McMillan Options Strategist Weekly
The stock market has rallied back strongly over the last week. There have some strange trading patterns, though. Each time there is strong buying -- on at least three of the recent days -- the market sprints ahead and then just sits there for the rest of the day, trading in a tight range. Without wanting to sound paranoid, this certainly seems like some sort of manipulation. Primary Open Market Operations (POMO) was rumored to be a factor -- which means the Fed was buying in line with QE2. But they buy bonds, not stocks.
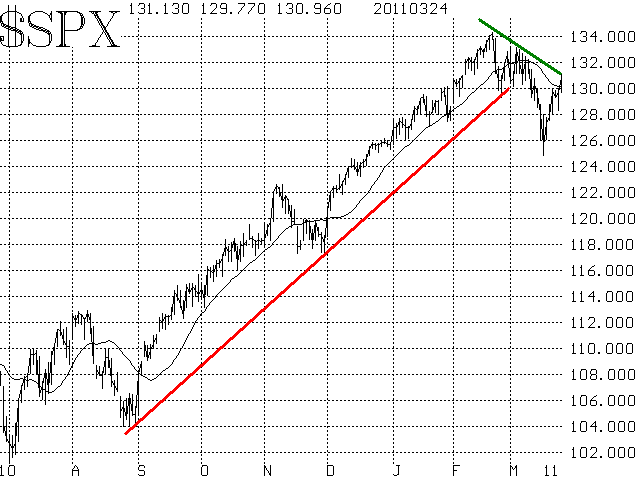
Regardless, it is what it is. $SPX has rallied back into resistance near and above 1300 -- penetrating back through its declining 20-day moving average in the process. Traders are trying to determine if this is a reversal of $SPX into a new intermediate-term up leg, or if it's just a pullback to resistance, with lower prices lying ahead. We've been saying $SPX would have to climb through 1315 in order to consider it back on a bullish path. There are a number of others seeing resistance in that general area as well. This likely means that if $SPX blows through 1315, there will be a lot of short covering.

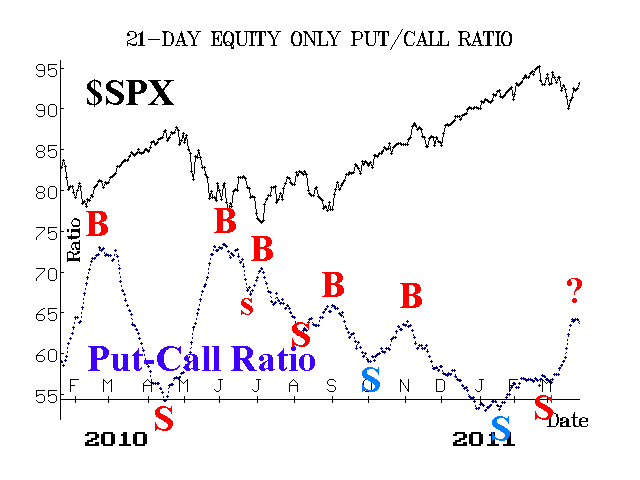
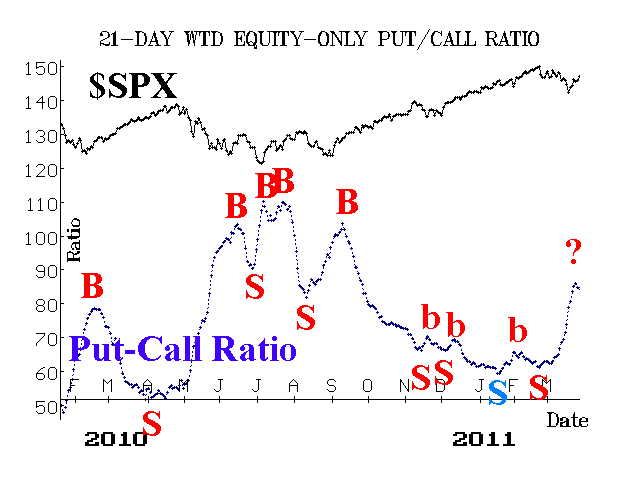
Equity-only put-call ratios showed a "wiggle" on their in the last two days. That isn't enough to generate a buy signal, but it is an interruption in the bearish uptrend on their charts (note: in Figures 2 and 3, the upper chart is now that of $SPX instead of $OEX; the two are virtually identical to each other on unscaled charts, such as these). If $SPX does break out over 1315, we might find that the equity-only charts are turning bullish at about the same time. That would be significant, and would help to clarify the picture. However, that is getting ahead of ourselves, since these events have not occurred yet.


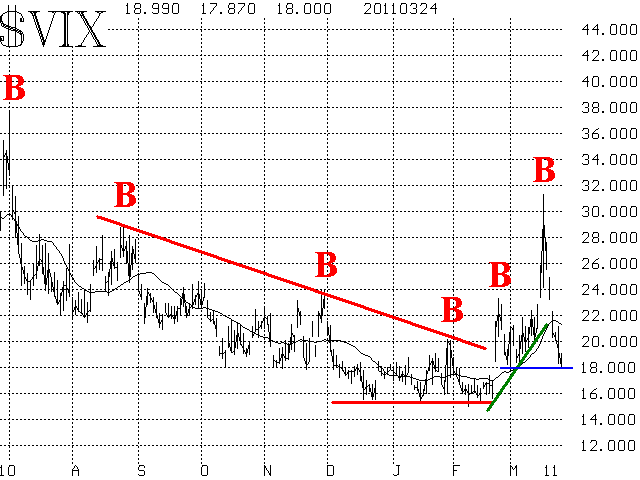
Volatility continues to decline in several ways. $VIX has continued to decline ever since registering a spike peak buy signal last week. In fact, the decline has been so steep that this is really more of an intermediate-term buy. However, $VIX is sitting right on 18. $VIX has bounced off the 18 level several times in recent weeks, so stock market bears are hoping for another bounce here. Even the most devout bears would have trouble interpreting $VIX as anything but bullish if it can close below 18.

As $VIX has declined, the $VIX futures have followed more slowly. As a result, the futures have gained quite a bit of premium this week -- moving from a situation in which they were all trading at discounts to one where they are once again all trading at premiums. The term structure never did slope downward (i.e., it never turned bearish) and now it is sloping upwards more steeply again (bullish).
As for the other measures that we follow, the Composite Implied Volatility (CIV) of all stock options had reached the 40th percentile last week, but now it has fallen back to the 17th percentile, so it is no longer bearish. Actual volatility has slowly increased; the 20-day historical volatility of $SPX reaching as high as 20% this week before falling back a little, and so it is somewhat bearish in that it is rising. Also, today saw the Daily Sentiment Index (DSI) rise back above 77%, so that is near the 80% level which would cancel the sell signal of last week, when it fell below 75%.
In summary, the bulls seem to have things going their way, but with $SPX so close to the breakout point, I would prefer to see the final confirmations of a new intermediate-term uptrend before trading on it: $SPX above 1315, $VIX below 18, and buy signals from the equity-only put-call ratios. At this point, none of those three conditions has been satisfied.
Lawrence G. McMillan is the author of two best selling books on options, including Options as a Strategic Investment, recognized as essential resources for any serious option trader's library.
|