| Corcoran Technical Trading Patterns For March 31 |
| By Clive Corcoran |
Published
03/31/2011
|
Currency , Stocks
|
Unrated
|
|
|
|
Corcoran Technical Trading Patterns For March 31
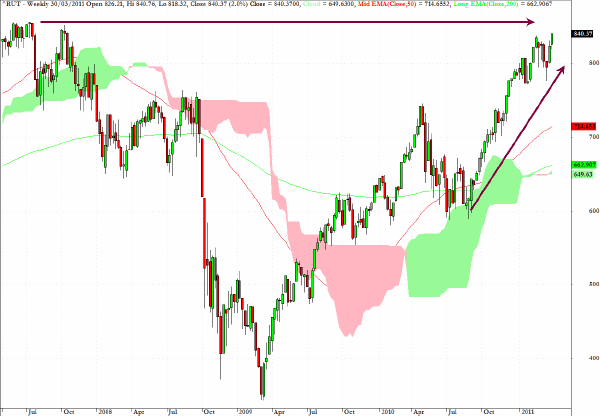
The Russell 2000 has continued racing ahead of the pack, and as we approach the end of the quarter, it is just conceivable that a last-minute spurt could see this micro-cap index challenge the previous historic high of 856 seen on July 13, 2007.
Remarkable in many respects, but readers will recall that the beta analysis provided here just over a week ago supported the view that there is a hunger for the micro-caps among fund managers who have so much liquidity to play with, that the new normal seems to be one of seeking out those assets which from a historical perspective are associated with relatively high risk.
Let’s hope that, after the end-of-quarter portfolio lipstick has been applied, these micro cap darlings don’t turn into ugly ducklings!
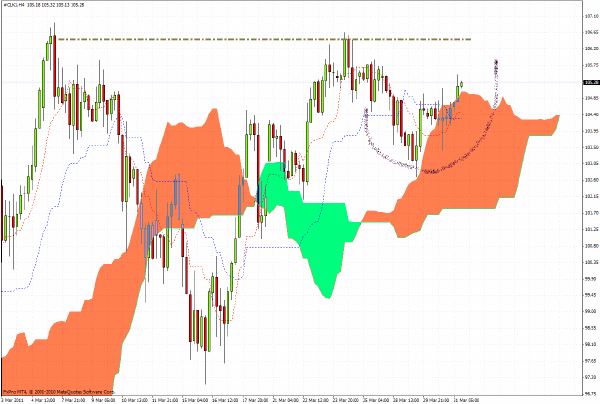
The chart for WTI Crude futures (May contract) is displaying a pattern on the 240-minute chart which has the appearance of an evolving cup with handle formation.
If the contract takes out the top of the cup ~ 106.60 then there could be a rather abrupt range expansion move to the upside. The situation in the Middle East and North Africa continues to provide a level of anxiety about supply and the real possibility that policy makers will be dissuaded from pro-nuclear positions for future energy supplies will only add to demand for carbon based fuels. Just as an aside the big upset for Angela Merkel in regional elections on Sunday was largely based on the Green party in Germany playing to the fears of the electorate about future nuclear plant developments in Germany.
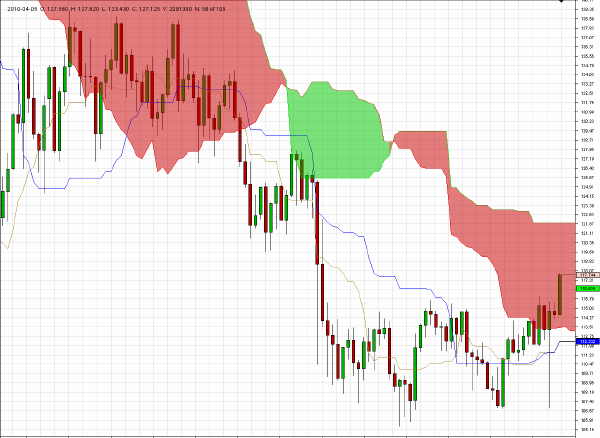
Here again is my comment from Tuesday’s commentary.
EUR/JPY is approaching the top of a well defined range or channel on its daily chart which has prevailed for more than a year.
The critical level is 116 and a break above that level would open up a move to the 120 level which is indicated as the target level of the weekly Ichimoku chart pattern.
Of all the FX possibilities at present for position traders this one would appear to be one of the most compelling on the long side. I would plan to exit part of the position at 120 and even leave a smaller remainder for a possible move to the actual top of the cloud at 122.
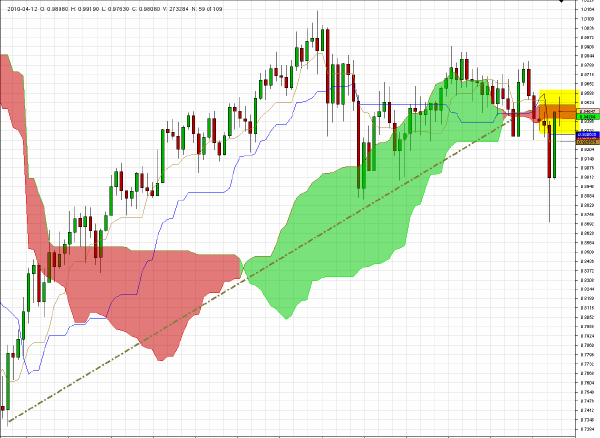
AUD/CHF, on the weekly chart, is revealing a doji star and that, in my estimation, captures the essence of the macro risk environment - evenly balanced in the short term but a sudden drop would both reflect and contribute to a more cautious approach to risk assets.
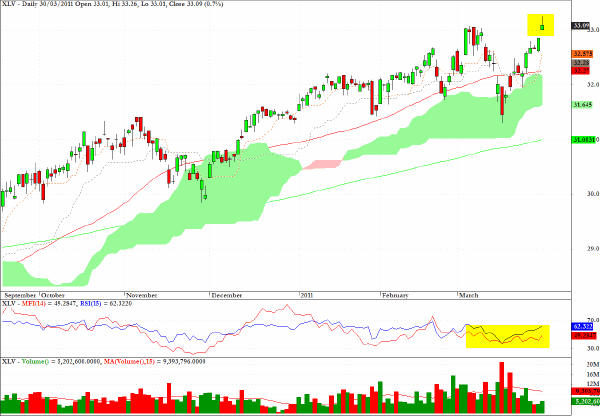
XLV - a sector fund for health care - shows that a possible island formation could develop and the MFI chart would suggest that there are more attractive economic sectors to be positioned on the long side.
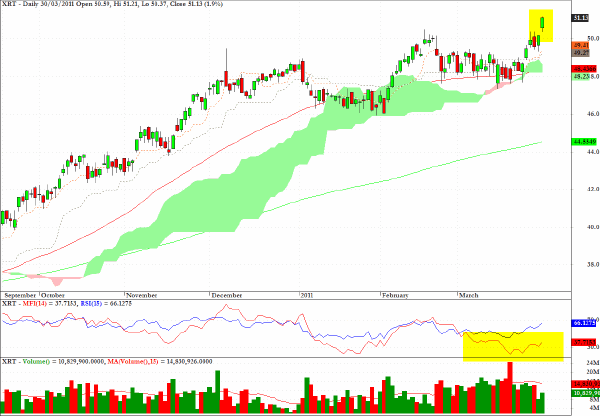
XRT, an ETF for the retail sector, shows a similar pattern to that seen above for XLV.
Clive Corcoran is the publisher of TradeWithForm.com, which provides daily analysis and commentary on the US stock market.
|