Anybody who has ever owned a car will know that mechanical problems can strike when they're least expected. That's why the wisest car maintenance is preventative maintenance - to prevent a problem before it becomes a problem. And to do that, you have to check under the hood, and look for potential problems there......something you can't do from the driver's seat. Unfortunately, you can't do preventative maintenance on the market. However, you can still "look under the hood", so to speak. Instead of looking for mechanical repairs to make, you would just want to know the true health of the market and decide if it was a potential lemon or not. Well, we did just that today - we looked under the market's hood. What we found wasn't disastrous, but it may be a bit surprising to a few bulls.
Lasting trends, both bullish and bearish, have both breadth and depth. By breadth, we mean the majority of stocks (not necessarily volume) are moving in that direction. By depth, we mean that most of the up/down trading volume is consistent with the current direction of the market. If you don't have both elements, the trends are usually short-lived.
But is there an easy way to measure the quality of breadth against the quality of depth? Yep, there sure is. We've talked about it before....it's the Arms Index, or 'TRIN', which is short for Trading Index.
As described, the TRIN is a comparison of advancing/declining issues and the advancing volume/declining volume. It was designed by Richard Arms to highlight points in time when there is an imbalance in the advancers/decliners and the underlying trade volume of those advancers and decliners. We're using the advancing/declining data for the New York Stock Exchange, but a TRIN reading can be calculated for any of the exchanges. The formula is as follows:
(# of Advancing Stocks / # of Declining Stocks) = ARMS INDEX
(Volume of Advancers / Volume of Decliners Stocks)
All things being equal, a perfectly balanced Arms Index would be 1.0. If the advancers or decliners become disproportionate with their corresponding volume, the Arms Index deviates from 1.0. Of course, the market always eventually finds its natural balance, so when the TRIN levels are highly skewed, we know a big reversal is probably in the works.
(Note that the TRIN reading can stay at 1.0 while the market is crashing or while bullishly running away; all the Arms Index is designed to do is point out an imbalance in the advancers/decliners and the volume behind those advances and declines. TRIN does not necessarily pinpoint the direction of a chart.)
(You may be wondering 'so what?' by now, but stick with us - it's definitely worth it!)
An Arms Index above 1.0 indicates that the volume in declining stocks outpaced the volume in advancing stocks. An index reading of up to 1.2 is still considered normal in a declining market. An Arms Index reading below 1.0 indicates the volume in advancing stocks was healthy and outpaced the volume in declining stocks. An index at the 0.85 level is still considered to be a sign of normal, healthy growth. It's when the TRIN readings start to fall outside of these ranges (above 1.3 and below 0.8) when the trend is getting ready to shift in the other direction. Oh yeah, one more thing - the daily TRIN readings are still too erratic to use by themselves. What we're using here is a 10 day moving average of the TRIN data. You'll soon see why this makes the tool much easier to use.
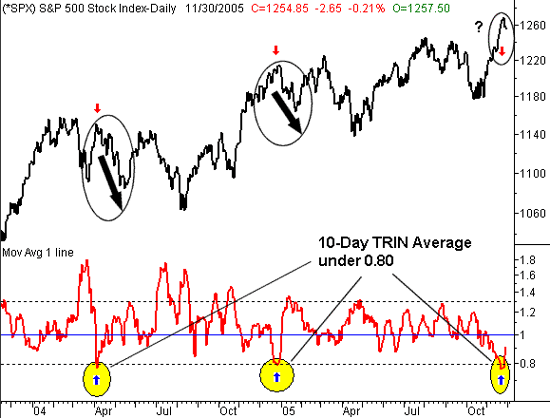
So why now? What suddenly makes the Arms Index such a hot topic? Because the 10-day moving average of the Arms Index is as low as we've seen it in almost a year! In fact, we've only seen it this low four times (counting this one) in the last two years. The three previous times we saw the 10 day TRIN average dip below 0.8 like it is now, the market went through a significant correction for a couple of weeks (only two of the three prior instances are shown on our chart). While the past never predicts the future, there's a correlation here that is too reliable to be ignored. On the chart below we've plotted the S&P 500 on top, and the 10 day average of the TRIN Index on the bottom. The arrows point out the days that the 10 day line tagged or fell under 0.80. You can decide for yourself if the present weakness was inevitable, and whether or not there's likely to be more on the way.
S&P 500 with 10 Day TRIN Average - Daily

So what was the missing ingredient this time? Well, this time we had good breadth, but no depth. That just means that despite the fact that there were more advancers than decliners since October, the volume of advancers had been dwindling. That imbalance has finally caught up with the market though, as we've seen this week. How much more do we have to go? That's hard to say....more than a little, less than a lot.
Anyway, we just thought it was a chart worth seeing, and one that you probably wouldn't see anywhere else. The Arms Index is a fantastic tool, and even though today's column may have seemed a bit complex, the application of TRIN data is actually pretty easy - and well worth it. In this case, it spotted a problem under the hood that wasn't all that evident on the surface.
Price Headley is the founder and chief analyst of BigTrends.com.