Let's return to our original three-signal-combo system. To review, we have three plus 1/minus 1 components. They will flash bullish if:
1. The daily close is above the 40-day moving average.
2. The 2-day closing average is higher than the 5-day.
3. The highest close of the last 50 days occurs before the lowest.
And vice versa for sells, as always. These daily plus/minus predictors always have at least a two out of three majority, which is your daily direction on the open that you'll exit on the close. Going with the majority each day produced positive biases in all nine of our targeted financial markets. This represented over 10,000 trades over a five-year period.
All signals were the same among the markets â€" a prudent course that minimizes the risk of over-optimization. An opposite approach would be to run optimization figures on each market individually, which will dramatically improve what we've seen. The problem is the results almost certainly won't carry into the future. All individual data banks have "magic numbers" that will stand out just by pure chance.
Yesterday, we raised the possibility that we might be standing on solid ground optimizing against sectors. I'll argue with anyone that there are differences among them. Nothing breaks out as decisively as the currencies. By contrast, successful index trading requires some sort of counter-trending element (as in fading an n-day closing average). Pork bellies hit daily limits far more than any other market. Grains become "hyper-markets" during their infrequent weather scares, but are pretty much dull otherwise. And Eurodollars are liquid, but not volatile.
So what about acknowledging such differences in our optimization? Granted, it may be a slippery slope trying to separate relevant differences from ones that just happen to be randomly turning up in our fields. I have to admit for this one that I don't have a confident answer. I'm thinking that once I start putting out mechanical recommendations, I'd lean more toward the universal numbers and maybe average the particular ones into that mix rather than trusting them as stand-alone signals.
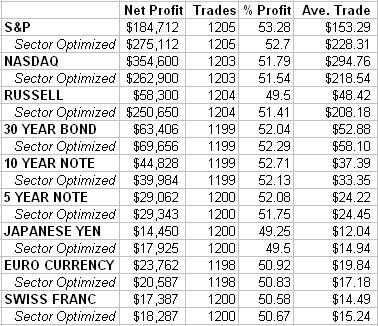
As usual though, we can at least check out what the results would be. The first row of each market is our previous one-size fits all rule across all markets and the second row contains optimized sets particular to each sector. These results contain five years of data.

We see a rather dramatic jump in the S&Ps and Russell. The 2- and 5-day indicator stayed the same, but the other two variables were shortened. The single close component now tracks 15 days. The order of the highest-lowest close indicator field has now been reduced to 10 days.
The other sectors don't yield such dramatic difference. One could argue going with the original numbers is probably preferable since they're conforming to wider fields. For the record though, the new bond numbers are 25 for the single moving average and 50 for the highest/lowest close. The 2- and 5-day indicator remains the same. In currencies, the 2- and 5-day indicator again remains the same (robustness!), as does 50 day highest/lowest close, the single moving average was 50 days.
P.S. I'd love to receive feedback from you. Please leave a comment or discuss the article by clicking on "Make a comment on this article" below.
Art Collins is the author of Market Beaters, a collection of interviews with renowned mechanical traders. He is currently working on a second volume. E-mail Art at artcollins@ameritech.net.